IMI PLC (IMI) - Stock Price & Dividends
Exchange: London Exchange • Country: United Kingdom • Currency: GBX • Type: Common Stock • ISIN: GB00BGLP8L22
IMI PLC, listed on the London Stock Exchange under the ticker symbol LSE:IMI, is a well-established engineering company that operates in various regions around the world. Its presence spans across the United Kingdom, Germany, Europe, the United States, Americas, China, Asia Pacific, the Middle East, and Africa.
The company is structured into three main segments: IMI Precision Engineering, IMI Critical Engineering, and IMI Hydronic Engineering. Under IMI Precision Engineering, products like motion and fluid control technologies are designed for applications in industrial automation, OEM precision fluid, and transportation. Well-known brands under this segment include Bimba, Norgren, and Kloehn.
IMI Critical Engineering is focused on providing flow control solutions for various industries such as power, oil & gas, and marine markets. Some of the valves and actuators offered are branded under names like IMI CCI, IMI NH, and IMI Fluid Kinetics.
The IMI Hydronic Engineering division delivers innovative water-based heating and cooling systems for residential and commercial buildings. Recognizable brands in this segment include IMI TA, IMI Pneumatex, and IMI Flow Design.
Founded in 1862 and headquartered in Birmingham, UK, IMI PLC was previously known as Imperial Metal Industries Limited. For more information on IMI PLC, you can visit their official website at https://www.imiplc.com.
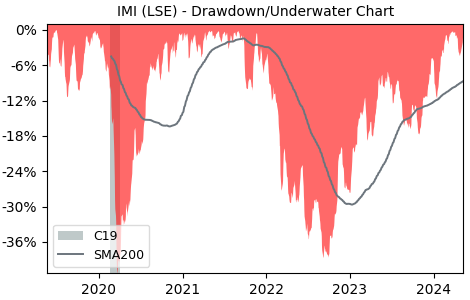
Drawdown (Underwater) Chart
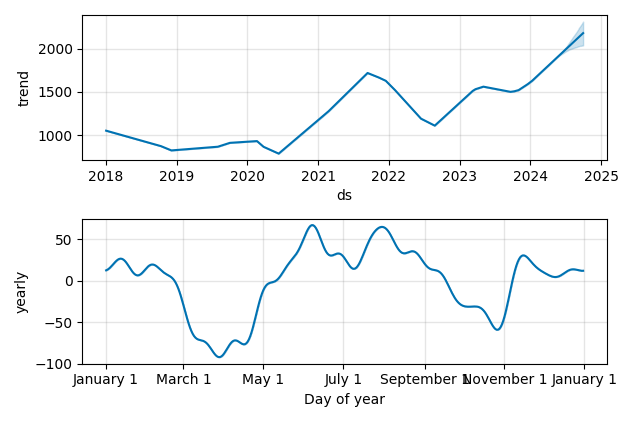
Overall Trend and Yearly Seasonality
IMI Stock Overview
| Market Cap in USD | 58m |
| Sector | Industrials |
| Industry | Specialty Industrial Machinery |
| GiC SubIndustry | Industrial Machinery & Supplies & Components |
| TER | 0.00% |
| IPO / Inception |
IMI Stock Ratings
| Growth 5y | 5.69 |
| Fundamental | 63.7 |
| Dividend | 3.51 |
| Rel. Performance vs Sector | -0.57 |
| Analysts | - |
| Fair Price Momentum | 1681.26 GBX |
| Fair Price DCF | 33.55 GBX |
IMI Dividends
| Yield 12m | 1.63% |
| Yield on Cost 5y | 3.13% |
| Dividends CAGR 5y | -8.31% |
| Payout Consistency | 95.4% |
IMI Growth Ratios
| Growth 12m | 12.30% |
| Growth Correlation 12m | 34% |
| Growth Correlation 3m | 52% |
| CAGR 5y | 13.80% |
| Sharpe Ratio 12m | 0.33 |
| Alpha vs SP500 12m | -10.94 |
| Beta vs SP500 5y weekly | 0.84 |
| ValueRay RSI | 23.71 |
| Volatility GJR Garch 1y | 25.92% |
| Price / SMA 50 | -1.27% |
| Price / SMA 200 | 8.08% |
| Current Volume | 616.7k |
| Average Volume 20d | 1015.1k |
External Links for IMI Stock
As of April 26, 2024, the stock is trading at GBX 1731.00 with a total of 616,654 shares traded.
Over the past week, the price has changed by +0.76%, over one month by -3.66%, over three months by +6.22% and over the past year by +13.53%.
According to ValueRays Forecast Model, IMI IMI PLC will be worth about 1856.3 in April 2025. The stock is currently trading at 1731.00. This means that the stock has a potential upside of +7.24%.
| Issuer | Forecast | Upside |
|---|---|---|
| Wallstreet Target Price | 2072 | 19.7 |
| Analysts Target Price | - | - |
| ValueRay Target Price | 1856.3 | 7.24 |