Segro Plc (SGRO) - Stock Price & Dividends
Exchange: London Exchange • Country: United Kingdom • Currency: GBX • Type: Common Stock • ISIN: GB00B5ZN1N88
SEGRO, listed on the London Stock Exchange and Euronext Paris, is a prominent real estate investment trust in the UK. Specializing in modern warehouses and industrial spaces, SEGRO owns or manages 10.3 million square meters of property valued at £21.0 billion. These spaces cater to a diverse range of industries and are strategically located in major cities and transportation hubs across the UK and seven other European countries.
For more than a century, SEGRO has been at the forefront of creating innovative spaces that facilitate remarkable achievements. Their diverse range of properties includes large-scale warehouses for regional, national, and international distribution, as well as urban warehouses close to bustling population centers and commercial districts. These high-quality assets empower their clients to flourish and succeed in their operations.
Beyond their business activities, SEGRO is deeply committed to driving positive societal and environmental change. Through their Responsible SEGRO framework, the company focuses on three key priorities - supporting low-carbon growth, investing in local communities and environments, and nurturing talent. By championing sustainability, fostering innovation, and enhancing economic and social well-being, SEGRO aims to set new benchmarks and be recognized as a top-tier property company.
To learn more about SEGRO and their impactful initiatives, visit their official website at https://www.segro.com.
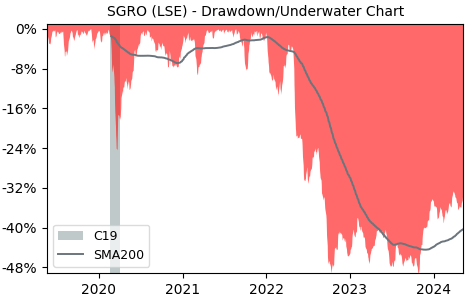
Drawdown (Underwater) Chart
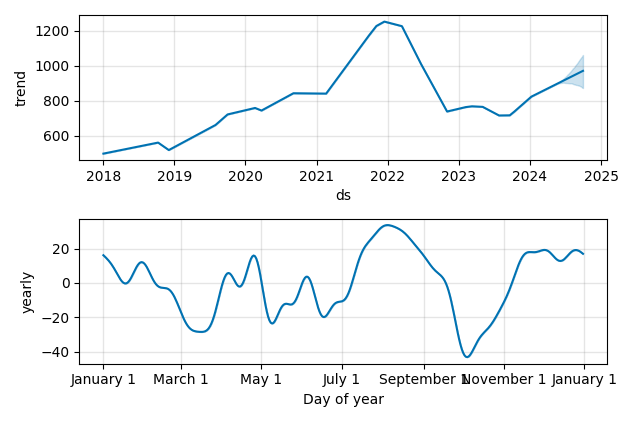
Overall Trend and Yearly Seasonality
SGRO Stock Overview
| Market Cap in USD | 143m |
| Sector | Real Estate |
| Industry | REIT - Industrial |
| GiC SubIndustry | Industrial REITs |
| TER | 0.00% |
| IPO / Inception |
SGRO Stock Ratings
| Growth 5y | 2.74 |
| Fundamental | -7.07 |
| Dividend | 7.72 |
| Rel. Performance vs Sector | 1.17 |
| Analysts | - |
| Fair Price Momentum | 791.35 GBX |
| Fair Price DCF | 9.32 GBX |
SGRO Dividends
| Yield 12m | 3.27% |
| Yield on Cost 5y | 4.67% |
| Dividends CAGR 5y | 6.59% |
| Payout Consistency | 95.4% |
SGRO Growth Ratios
| Growth 12m | 8.30% |
| Growth Correlation 12m | 45% |
| Growth Correlation 3m | 34% |
| CAGR 5y | 7.32% |
| Sharpe Ratio 12m | 0.12 |
| Alpha vs SP500 12m | -13.30 |
| Beta vs SP500 5y weekly | 0.76 |
| ValueRay RSI | 37.05 |
| Volatility GJR Garch 1y | 24.49% |
| Price / SMA 50 | -0.82% |
| Price / SMA 200 | 7.85% |
| Current Volume | 2017.5k |
| Average Volume 20d | 4190.3k |
External Links for SGRO Stock
As of April 25, 2024, the stock is trading at GBX 849.00 with a total of 2,017,495 shares traded.
Over the past week, the price has changed by +2.59%, over one month by -5.65%, over three months by +2.11% and over the past year by +9.03%.
According to ValueRays Forecast Model, SGRO Segro Plc will be worth about 864.4 in April 2025. The stock is currently trading at 849.00. This means that the stock has a potential upside of +1.81%.
| Issuer | Forecast | Upside |
|---|---|---|
| Wallstreet Target Price | 958 | 12.8 |
| Analysts Target Price | - | - |
| ValueRay Target Price | 864.4 | 1.81 |