Revance The (RVNC) - Stock Price & Dividends
Exchange: USA Stocks • Country: United States • Currency: USD • Type: Common Stock • ISIN: US7613301099
Revance Therapeutics, Inc. is a biotechnology company that focuses on developing, manufacturing, and selling neuromodulators for both aesthetic and therapeutic purposes. They operate in the United States and globally. Their main product in development, DaxibotulinumtoxinA, has gone through phase III clinical trials targeting glabellar lines and cervical dystonia. It is currently undergoing phase II trials for upper facial lines, dynamic forehead lines, and lateral canthal lines. Additionally, the drug has completed phase II trials for adult upper limb spasticity and plantar fasciitis.
Besides their primary drug candidate, Revance Therapeutics, Inc. is working on OnabotulinumtoxinA, a biosimilar to BOTOX. They also provide Resilient Hyaluronic Acid (RHA) dermal filler for moderate to severe dynamic facial wrinkles, RHA Redensity for dynamic perioral rhytids, and OPUL Relational Commerce Platform, a financial technology tool. The company collaborates with Viatris Inc. for the production and commercialization of OnabotulinumtoxinA.
Established in 1999 as Essentia Biosystems, Inc., the company rebranded to Revance Therapeutics, Inc. in 2005. Headquartered in Nashville, Tennessee, the company's website is https://www.revance.com.
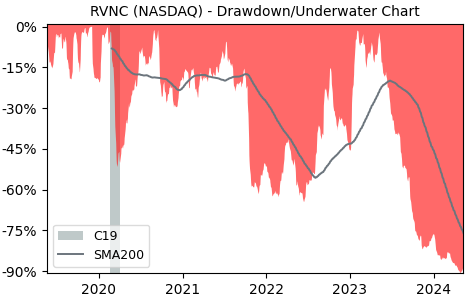
Drawdown (Underwater) Chart
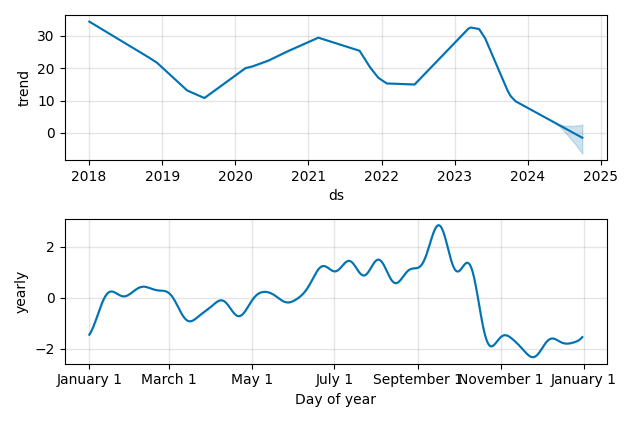
Overall Trend and Yearly Seasonality
RVNC Stock Overview
| Market Cap in USD | 460m |
| Sector | Healthcare |
| Industry | Biotechnology |
| GiC SubIndustry | Pharmaceuticals |
| TER | 0.00% |
| IPO / Inception | 2014-02-06 |
RVNC Stock Ratings
| Growth 5y | -4.29 |
| Fundamental | -5.41 |
| Dividend | - |
| Rel. Performance vs Sector | -21.40 |
| Analysts | 4.00/5 |
| Fair Price Momentum | 2.90 USD |
| Fair Price DCF | - |
RVNC Dividends
| Yield 12m | 0.00% |
| Yield on Cost 5y | 0.00% |
| Dividends CAGR 5y | 0.00% |
| Payout Consistency | 0.0% |
RVNC Growth Ratios
| Growth 12m | -88.34% |
| Growth Correlation 12m | -88% |
| Growth Correlation 3m | -50% |
| CAGR 5y | -22.30% |
| Sharpe Ratio 12m | -1.22 |
| Alpha vs SP500 12m | -120.85 |
| Beta vs SP500 5y weekly | 1.53 |
| ValueRay RSI | 43.07 |
| Volatility GJR Garch 1y | 60.03% |
| Price / SMA 50 | -27.67% |
| Price / SMA 200 | -64.31% |
| Current Volume | 1598k |
| Average Volume 20d | 1493k |
External Links for RVNC Stock
Wall Street Journal • Benzinga • Yahoo Finance
Tweets
X (Twitter) • Stocktwits
Fund Manager Positions
Dataroma • Stockcircle
As of April 19, 2024, the stock is trading at USD 3.79 with a total of 1,598,010 shares traded.
Over the past week, the price has changed by -14.64%, over one month by -23.28%, over three months by -34.66% and over the past year by -87.59%.
According to ValueRays Forecast Model, RVNC Revance The will be worth about 3.2 in April 2025. The stock is currently trading at 3.79. This means that the stock has a potential downside of -16.36%.
| Issuer | Forecast | Upside |
|---|---|---|
| Wallstreet Target Price | 14.9 | 293.4% |
| Analysts Target Price | 36.6 | 864.4% |
| ValueRay Target Price | 3.2 | -16.4% |