US Silica Holdings (SLCA) - Stock Price & Dividends
Exchange: USA Stocks • Country: United States • Currency: USD • Type: Common Stock • ISIN: US90346E1038
Silica Products, Proppants, Quartz, Diatomaceous Earth, Clay, Perlite
U.S. Silica Holdings, Inc. produces and sells commercial silica in the United States. It operates through two segments: Oil & Gas Proppants and Industrial & Specialty Products. The company offers whole grain commercial silica products to be used as frac for oil and natural gas recovery, as well as sells its whole grain silica products for the manufacturing of glass products. It also provides various grades of whole-grain round silica to the foundry industry; ground silica and industrial minerals products used for various products; and engineered performance materials made from diatomaceous earth (DE), clay, and perlite. In addition, the company offers transportation, equipment rental, and contract labor services. It serves oilfield services companies, and exploration and production companies that are engaged in hydraulic fracturing, building and construction products, chemicals, fillers and extenders, filtration, glass, sports, recreation, and industrial and specialty products end markets. The company was formerly known as GGC USS Holdings Inc. and changed its name to U.S. Silica Holdings, Inc. in July 2011. U.S. Silica Holdings, Inc. was founded in 1894 and is headquartered in Katy, Texas. Web URL: https://www.ussilica.com
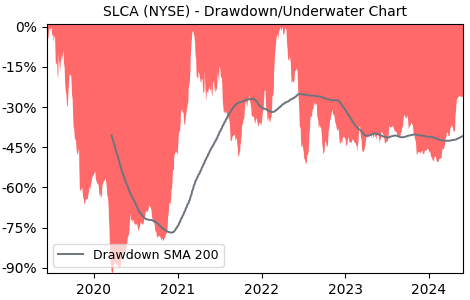
Drawdown (Underwater) Chart
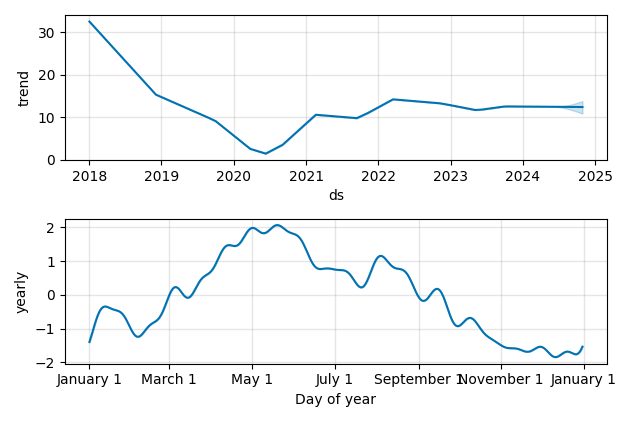
Overall Trend and Yearly Seasonality
SLCA Stock Overview
| Market Cap in USD | 1,217m |
| Sector | Energy |
| Industry | Oil & Gas Equipment & Services |
| GiC SubIndustry | Oil & Gas Equipment & Services |
| TER | 0.00% |
| IPO / Inception | 2012-02-01 |
SLCA Stock Ratings
| Growth 5y | 1.90 |
| Fundamental | 0.80 |
| Dividend | - |
| Rel. Performance vs Sector | 0.27 |
| Analysts | - |
| Fair Price Momentum | 14.12 USD |
| Fair Price DCF | 72.14 USD |
SLCA Dividends
| Yield 12m | 0.00% |
| Yield on Cost 5y | 0.00% |
| Dividends CAGR 5y | -100.00% |
| Payout Consistency | 45.2% |
SLCA Growth Ratios
| Growth 12m | 30.07% |
| Growth Correlation 12m | -9% |
| Growth Correlation 3m | 75% |
| CAGR 5y | 4.20% |
| CAGR/Mean DD 5y | 0.10 |
| Sharpe Ratio 12m | 0.62 |
| Alpha vs SP500 12m | -24.65 |
| Beta vs SP500 5y weekly | 2.05 |
| ValueRay RSI | 81.65 |
| Volatility GJR Garch 1y | 60.97% |
| Price / SMA 50 | 16.07% |
| Price / SMA 200 | 26.47% |
| Current Volume | 762.3k |
| Average Volume 20d | 2022.6k |
External Links for SLCA Stock
News
Wall Street Journal • Benzinga • Yahoo Finance
Tweets
X • Stocktwits
Fund Manager Positions
Dataroma • Stockcircle
Wall Street Journal • Benzinga • Yahoo Finance
Tweets
X • Stocktwits
Fund Manager Positions
Dataroma • Stockcircle
What is the price of SLCA stocks?
As of May 15, 2024, the stock is trading at USD 15.53 with a total of 762,300 shares traded.
Over the past week, the price has changed by +0.32%, over one month by +18.91%, over three months by +50.34% and over the past year by +27.19%.
As of May 15, 2024, the stock is trading at USD 15.53 with a total of 762,300 shares traded.
Over the past week, the price has changed by +0.32%, over one month by +18.91%, over three months by +50.34% and over the past year by +27.19%.
What is the forecast for SLCA stock price target?
According to ValueRays Forecast Model, SLCA US Silica Holdings will be worth about 15.7 in May 2025. The stock is currently trading at 15.53. This means that the stock has a potential upside of +0.9%.
According to ValueRays Forecast Model, SLCA US Silica Holdings will be worth about 15.7 in May 2025. The stock is currently trading at 15.53. This means that the stock has a potential upside of +0.9%.
| Issuer | Forecast | Upside |
|---|---|---|
| Wallstreet Target Price | 15.5 | -0.19 |
| Analysts Target Price | 15 | -3.41 |
| ValueRay Target Price | 15.7 | 0.90 |