(COMT) iShares GSCI Commodity - Performance -3.3% in 12m
Compare COMT with Indices, Sectors and Commodities and Bonds. Who performs better in which timeframe?
Performance Rating
43.74%
#17 in Peer-Group
Rel. Strength
41.21%
#4468 in Stock-Universe
Total Return 12m
-3.33%
#18 in Peer-Group
Total Return 5y
85.15%
#10 in Peer-Group
| P/E | Value |
|---|---|
| P/E Trailing | - |
| P/E Forward | - |
| High / Low | USD |
|---|---|
| 52 Week High | 26.96 USD |
| 52 Week Low | 23.43 USD |
| Sentiment | Value |
|---|---|
| VRO Trend Strength +-100 | 62.71 |
| Buy/Sell Signal +-5 | 0.14 |
| Support / Resistance | Levels |
|---|---|
| Support | |
| Resistance |
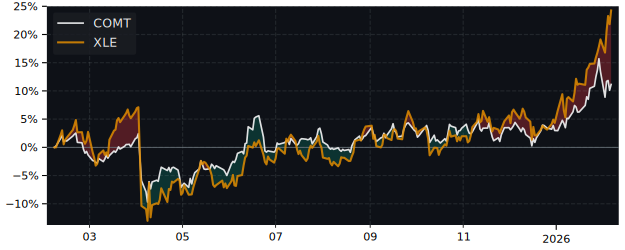
12m Total Return: COMT (-3.3%) vs XLE (-8.3%)
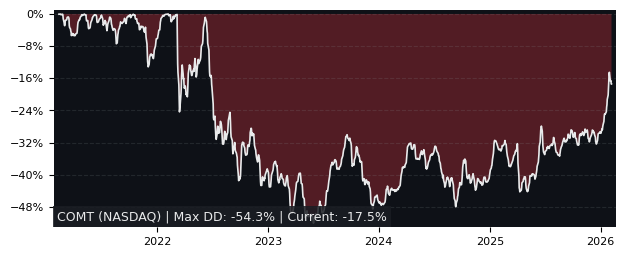
5y Drawdown (Underwater) Chart
Top Performer in Commodities Broad Basket
Overall best picks of Peer Group - Selected by proven GARP Predictive Metrics, sorted by Growth Rating
| Symbol | 1m | 12m | 5y | P/E | P/E Forward | PEG | EPS Stability | EPS CAGR |
|---|---|---|---|---|---|---|---|---|
| USCI NYSE ARCA United States Commodity |
1.53% | 14.9% | 168% | - | - | - | - | - |
| SDCI NYSE ARCA USCF SummerHaven Dynamic |
1.4% | 15.6% | 186% | - | - | - | - | - |
| FTGC NASDAQ First Trust Global Tactical |
-0.45% | 2.44% | 107% | - | - | - | - | - |
| BCD NYSE ARCA abrdn Bloomberg All |
0.18% | 1.26% | 104% | - | - | - | - | - |
| GCC NYSE ARCA WisdomTree Continuous |
2% | 4.15% | 84% | - | - | - | - | - |
| COM NYSE ARCA Direxion Auspice Broad |
-0.52% | -1.7% | 71.9% | - | - | - | - | - |
| DJP NYSE ARCA iPath Bloomberg Commodity |
-0.35% | 0.09% | 98.8% | - | - | - | - | - |
| GSG NYSE ARCA iShares S&P GSCI |
-0.79% | -3.65% | 121% | - | - | - | - | - |
Performance Comparison: COMT vs XLE vs S&P 500
XLE (Energy Sector SPDR Fund ETF) is the Sector Benchmark for COMT
| Total Return (including Dividends) | COMT | XLE | S&P 500 |
|---|---|---|---|
| 1 Month | -0.20% | 0.42% | 10.59% |
| 3 Months | -4.53% | -9.44% | -2.07% |
| 12 Months | -3.33% | -8.32% | 11.45% |
| 5 Years | 85.15% | 153.94% | 109.69% |
| Trend Score (consistency of price movement) | COMT | XLE | S&P 500 |
|---|---|---|---|
| 1 Month | 46.9% | 36.8% | 90% |
| 3 Months | -59.7% | -55.1% | -6.7% |
| 12 Months | -0.6% | -16.2% | 46.4% |
| 5 Years | 62.8% | 93.6% | 84.1% |
| Relative Strength (compared with Indexes) | Rank in Peer Group | vs. XLE | vs. S&P 500 |
|---|---|---|---|
| 1 Month | #14 | -0.61% | -9.76% |
| 3 Month | #14 | 5.42% | -2.51% |
| 12 Month | #19 | 5.44% | -13.27% |
| 5 Years | #15 | -27.09% | -11.70% |
FAQs
Does iShares GSCI Commodity (COMT) outperform the market?
Yes,
over the last 12 months COMT made -3.33%, while its related Sector, the Energy Sector SPDR Fund (XLE) made -8.32%.
Over the last 3 months COMT made -4.53%, while XLE made -9.44%.
Performance Comparison COMT vs Indeces and Sectors
Above 0 means better perfomance compared to Symbol in this Timeframe
COMT vs. Indices
| Symbol | 1w | 1m | 6m | 12m | |
|---|---|---|---|---|---|
| US S&P 500 | SPY | 1.3% | -10.8% | 1% | -15% |
| US NASDAQ 100 | QQQ | 1.1% | -15.8% | -2.4% | -17% |
| German DAX 40 | DAX | -1.2% | -12.7% | -24.2% | -31% |
| Shanghai Shenzhen CSI 300 | CSI 300 | -0.1% | -5% | -3.2% | -12% |
| Hongkong Hang Seng | HSI | 0.2% | -11.6% | -13.6% | -15% |
| India NIFTY 50 | INDA | 1.9% | -0.7% | -0.4% | -5% |
| Brasil Bovespa | EWZ | 1.8% | -6.6% | -5.1% | 0% |
COMT vs. Sectors
| Symbol | 1w | 1m | 6m | 12m | |
|---|---|---|---|---|---|
| Communication Services | XLC | 0.5% | -11.4% | -4.9% | -26% |
| Consumer Discretionary | XLY | 1.5% | -14.4% | 1.6% | -25% |
| Consumer Staples | XLP | -0.1% | 0.9% | -1.1% | -11% |
| Energy | XLE | 4.6% | -0.6% | 14.2% | 5% |
| Financial | XLF | 2.1% | -6.7% | -0.3% | -25% |
| Health Care | XLV | 0% | 3.1% | 8.2% | 6% |
| Industrial | XLI | 0.7% | -13.6% | -0.3% | -18% |
| Materials | XLB | 0.4% | -5.7% | 7.4% | 1% |
| Real Estate | XLRE | 2.2% | -0.7% | 5.8% | -14% |
| Technology | XLK | 2.3% | -19.4% | 1% | -11% |
| Utilities | XLU | 1.2% | -2.9% | -0.3% | -18% |
| Aerospace & Defense | XAR | 1.2% | -15.9% | -8.1% | -33% |
| Biotech | XBI | -2.1% | -2.3% | 17.2% | 11% |
| Homebuilder | XHB | 4.2% | -3.4% | 19.8% | 5% |
| Retail | XRT | 0% | -12.6% | 5.5% | -7% |
COMT vs. Commodities
| Symbol | 1w | 1m | 6m | 12m | |
|---|---|---|---|---|---|
| Oil | USO | 0.8% | 3.01% | 9.13% | 7% |
| Natural Gas | UNG | 1% | -5.7% | -16.8% | 16% |
| Gold | GLD | -1.7% | 2.4% | -21.8% | -41% |
| Silver | SLV | -1.3% | -2% | -5.9% | -10% |
| Copper | CPER | 0.2% | 3.6% | -14.3% | -2% |
COMT vs. Bonds
| Symbol | 1w | 1m | 6m | 12m | |
|---|---|---|---|---|---|
| iShares 20+ Years Bond | TLT | 2% | 1.8% | 4.2% | 1% |
| iShares High Yield Corp. Bond | HYG | 0.5% | -2.5% | -2.7% | -12% |