DOMH Performance & Benchmarks - 216.6% in 12m
The Total Return for 3m is -0.6%, for 6m 69.1% and YTD 430.7%. Compare with Peer-Group: Investment Banking & Brokerage
Performance Rating
-47.36%
#62 in Peer-Group
Rel. Strength
97.61%
#185 in Stock-Universe
Total Return 12m
216.60%
#2 in Peer-Group
Total Return 5y
-73.74%
#65 in Peer-Group
| P/E | Value |
|---|---|
| P/E Trailing | - |
| P/E Forward | - |
| High / Low | USD |
|---|---|
| 52 Week High | 12.49 USD |
| 52 Week Low | 0.86 USD |
| Sentiment | Value |
|---|---|
| VRO Trend Strength +-100 | 45.74 |
| Buy/Sell Signal +-5 | 2.25 |
| Support / Resistance | Levels |
|---|---|
| Support | |
| Resistance |
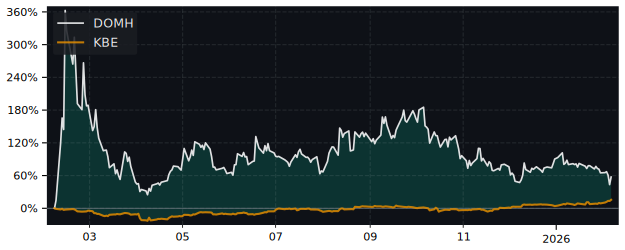
12m Total Return: DOMH (216.6%) vs XLF (29%)
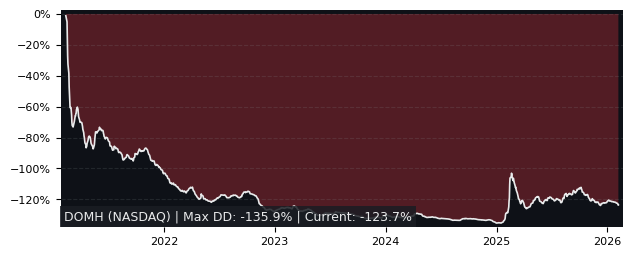
5y Drawdown (Underwater) Chart
Top Performer in Investment Banking & Brokerage
Short Term Performance
| Symbol | 1w | 1m | 3m |
|---|---|---|---|
| DOMH | -4.38% | -1.57% | -0.59% |
| RILY | -15.0% | 58.1% | 79.3% |
| FUTU | -7.22% | 22.6% | 49.2% |
| PLUT | 0.0% | 34.7% | 27.8% |
Long Term Performance
| Symbol | 6m | 12m | 5y |
|---|---|---|---|
| DOMH | 69.1% | 217% | -73.7% |
| NDA | -46.4% | 329% | 321% |
| FUTU | 52.9% | 178% | 312% |
| IBKR | 17.3% | 139% | 415% |
Overall best picks of Peer Group - Selected by proven GARP Predictive Metrics, sorted by Growth Rating
| Symbol | 1m | 12m | 5y | P/E | P/E Forward | PEG | EPS Stability | EPS CAGR |
|---|---|---|---|---|---|---|---|---|
| LPLA NASDAQ LPL Financial Holdings |
-1.62% | 94.9% | 366% | 26.3 | 22 | 1.79 | 47.3% | 29.1% |
| RJF NYSE Raymond James Financial |
5.85% | 58.7% | 274% | 16.4 | 14.7 | 1.4 | 37.3% | 2.13% |
| MS NYSE Morgan Stanley |
-0.97% | 58.1% | 236% | 15.8 | 17 | 1.76 | 66.5% | 12.7% |
| PJT NYSE PJT Partners |
6.36% | 54.2% | 253% | 30.7 | 28.7 | 1.36 | -19.1% | 2.03% |
| SF NYSE Stifel Financial |
4.49% | 44.8% | 265% | 21.5 | 11.8 | 0.85 | -8.80% | 1.28% |
| EVR NYSE Evercore Partners |
5.72% | 36.8% | 452% | 26.7 | 29.6 | 1.13 | 34.1% | 8.46% |
| SCHW NYSE Charles Schwab |
4.86% | 58.1% | 212% | 26.3 | 21.2 | 0.84 | 16.6% | 3.02% |
| BGC NASDAQ BGC |
-9.78% | 17.4% | 263% | 31.6 | - | 1.22 | 78.3% | 214% |
Performance Comparison: DOMH vs XLF vs S&P 500
XLF (Financial Sector SPDR Fund ETF) is the Sector Benchmark for DOMH
| Total Return (including Dividends) | DOMH | XLF | S&P 500 |
|---|---|---|---|
| 1 Month | -1.57% | -1.46% | 1.69% |
| 3 Months | -0.59% | 5.36% | 12.34% |
| 12 Months | 216.60% | 29.02% | 23.51% |
| 5 Years | -73.74% | 133.66% | 102.76% |
| Trend Stabilty (consistency of price movement) | DOMH | XLF | S&P 500 |
|---|---|---|---|
| 1 Month | -29.6% | 9.6% | 68.6% |
| 3 Months | -21.4% | 79.4% | 96.5% |
| 12 Months | 70.2% | 78% | 50.2% |
| 5 Years | -79% | 75% | 84% |
| Relative Strength (compared with Indexes) | Rank in Peer Group | vs. XLF | vs. S&P 500 |
|---|---|---|---|
| 1 Month | 38 %th | -0.11% | -3.20% |
| 3 Month | 31 %th | -5.65% | -11.51% |
| 12 Month | 99 %th | 145.39% | 156.32% |
| 5 Years | 10 %th | -88.76% | -87.05% |
FAQs
Does Dominari Holdings (DOMH) outperform the market?
Yes,
over the last 12 months DOMH made 216.60%, while its related Sector, the Financial Sector SPDR Fund (XLF) made 29.02%.
Over the last 3 months DOMH made -0.59%, while XLF made 5.36%.
Performance Comparison DOMH vs Indeces and Sectors
Above 0 means better perfomance compared to Symbol in this Timeframe
DOMH vs. Indices
| Symbol | 1w | 1m | 6m | 12m | |
|---|---|---|---|---|---|
| US S&P 500 | SPY | -3.5% | -3.3% | 63.6% | 193% |
| US NASDAQ 100 | QQQ | -3.7% | -3.8% | 61.2% | 186% |
| German DAX 40 | DAX | -3.5% | -0.3% | 59.1% | 180% |
| Shanghai Shenzhen CSI 300 | CSI 300 | -3% | -4.9% | 60.6% | 195% |
| Hongkong Hang Seng | HSI | -2.4% | -5.8% | 40.8% | 175% |
| India NIFTY 50 | INDA | -3% | 3.6% | 67% | 220% |
| Brasil Bovespa | EWZ | -5.9% | 4.3% | 61.3% | 210% |
DOMH vs. Sectors
| Symbol | 1w | 1m | 6m | 12m | |
|---|---|---|---|---|---|
| Communication Services | XLC | -5.4% | -2.7% | 64% | 184% |
| Consumer Discretionary | XLY | -1% | -1.7% | 74.3% | 188% |
| Consumer Staples | XLP | -4.2% | 0.3% | 65.4% | 210% |
| Energy | XLE | -1.3% | -0.7% | 72.7% | 215% |
| Financial | XLF | -2.2% | -0.1% | 66.8% | 188% |
| Health Care | XLV | -2.7% | -0.6% | 77.8% | 224% |
| Industrial | XLI | -2.2% | -3.1% | 58.1% | 189% |
| Materials | XLB | -0.9% | 1.3% | 69.5% | 215% |
| Real Estate | XLRE | -3.4% | -2% | 66.8% | 211% |
| Technology | XLK | -3.7% | -4.5% | 55.1% | 183% |
| Utilities | XLU | -8.8% | -8% | 55% | 192% |
| Aerospace & Defense | XAR | -2.8% | -5% | 44.7% | 161% |
| Biotech | XBI | -4.7% | -5.5% | 75.3% | 224% |
| Homebuilder | XHB | -3.6% | -6.1% | 69.3% | 218% |
| Retail | XRT | -1.8% | -1% | 68.9% | 205% |
DOMH vs. Commodities
| Symbol | 1w | 1m | 6m | 12m | |
|---|---|---|---|---|---|
| Oil | USO | -3% | -1.09% | 70.9% | 213% |
| Natural Gas | UNG | 0.8% | 12.7% | 93.1% | 216% |
| Gold | GLD | -6.2% | -2.7% | 50.6% | 177% |
| Silver | SLV | -2.5% | -3.2% | 52.8% | 180% |
| Copper | CPER | 15.9% | 9.4% | 68.2% | 206% |
DOMH vs. Bonds
| Symbol | 1w | 1m | 6m | 12m | |
|---|---|---|---|---|---|
| iShares 20+ Years Bond | TLT | -7.3% | -4.2% | 67.3% | 224% |
| iShares High Yield Corp. Bond | HYG | -4.6% | -2.3% | 65.1% | 206% |