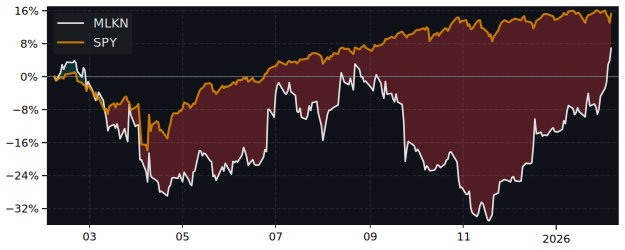
MLKN Performance: -3.5% Return (12 Months)
MLKN returned -3.5% over 12 months, underperforming the S&P 500 (37.7%). Volatility: 43.6%.
| P/E Trailing | 95.6 |
| P/E Forward | 6.25 |
| 52 Week High | 22.65 USD |
| 52 Week Low | 13.59 USD |
| VRO Trend Strength ±100 | 16.22 |
| Buy Signal ±3 | -0.57 |
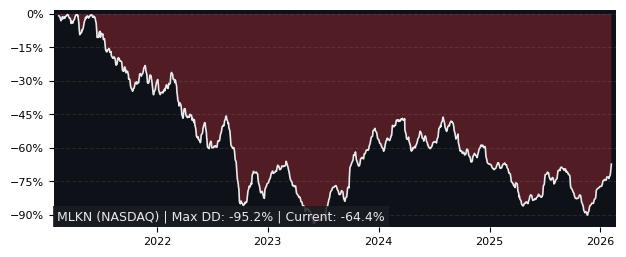
| Max Drawdown | 53.31% |
| Mean Drawdown | 21.86% |
Top Performer in Commercial Services & Supplies (5/51)
| SYMBOL | 1W | 1M | 3M |
|---|---|---|---|
| SPIR | 53.21% | 98.07% | 96.93% |
| DBG | 6.57% | 8.30% | 27.98% |
| CLH | 4.32% | 5.83% | 22.26% |
| EBF | 2.27% | 4.54% | 22.14% |
| GEO | 2.65% | 29.29% | 6.27% |
| MLKN | 3.59% | -21.40% | -21.39% |
| SYMBOL | 6M | 12M | 5Y |
|---|---|---|---|
| SPIR | 45.91% | 134.29% | -74.25% |
| DLX | 53.43% | 112.62% | -12.75% |
| VSEC | 28.32% | 98.41% | 414.09% |
| DBG | 56.60% | 80.59% | 43.48% |
| UNF | 57.55% | 60.76% | 18.24% |
| MLKN | -8.27% | -3.49% | -60.02% |
| SYMBOL | MCAP | 1M | 12M | 5Y | P/E | P/E fwd | PEG | EPS stab | EPS cagr |
|---|---|---|---|---|---|---|---|---|---|
| BRC NYSE Brady |
3.81B | -4.69% | 31.2% | 62.7% | 18.9 | 15.4 | 1.67 | 86.5% | 9.33% |
| CMPR NASDAQ Cimpress |
1.83B | 8.79% | 96.0% | -27.4% | 75.7 | 16.7 | 2.38 | 53.4% | 30.8% |
| WM NYSE Waste Management |
95.0B | -5.74% | 8.53% | 86.1% | 35.1 | 28.5 | 2.39 | -14.5% | -45.2% |
| MSA NYSE MSA Safety |
6.43B | -7.32% | 30.6% | 17.7% | 23.4 | 19.6 | 0.99 | -12.6% | -42.8% |
| TILE NASDAQ Interface |
1.45B | -4.74% | 48.0% | 110% | 12.7 | 12.2 | 0.81 | 22.9% | -48.5% |
| PBI NYSE Pitney Bowes |
1.64B | 3.37% | 45.0% | 62.7% | 13.1 | 7.77 | 0.52 | 79.2% | 58.5% |
| RSG NYSE Republic |
69.0B | -5.66% | -3.66% | 123% | 32.6 | 30.7 | 3.20 | -9.90% | -45.6% |
Performance: MLKN vs S&P 500
| PERIOD | MLKN | S&P 500 |
|---|---|---|
| 1 Week | 3.59% | 3.17% |
| 1 Month | -21.40% | -0.06% |
| 3 Months | -21.39% | -1.69% |
| 6 Months | -8.27% | 1.00% |
| 12 Months | -3.49% | 37.72% |
| 5 Years | -60.02% | 75.84% |
MLKN Performance FAQ
Does MLKN outperform the market?
No, MLKN underperforms the market. Over the past 12 months, MLKN returned -3.49% compared to 37.72% for the S&P 500.
What is the MLKN return over the last 12 months?
MLKN has returned -3.49% over the past 12 months, including dividends. Over 3 months the return was -21.39%, and over 5 years -60.02%.
How risky is MLKN?
MLKN has relatively low risk with a maximum drawdown of 53.31% over the past 3 years. The average drawdown is 21.86%.
MLKN vs Sectors (12m)
Sorted by outperformance. Positive = MLKN beats sector.
| SECTOR | ETF | DIFFERENCE 12M |
|---|---|---|
| Consumer Staples | XLP | -14.9% |
| Health Care | XLV | -18.1% |
| Financials | XLF | -21.9% |
| Real Estate | XLRE | -21.9% |
| Consumer Discretionary | XLY | -30.2% |
| Consumer Discretionary | XLY | -30.2% |
| Communication Services | XLC | -37.3% |
| Materials | XLB | -45.6% |
| Industrials | XLI | -51.9% |
| Energy | XLE | -60.3% |
| Technology | XLK | -62.1% |
MLKN vs Asset Classes (12m)
| ASSET CLASS | ETF | DIFFERENCE 12M |
|---|---|---|
| S&P 500 | SPY | -41.2% |
| Emerging Market | EEM | -64.2% |
| Gold | GLD | -61.4% |
| Long-Term Bonds | TLT | -6.3% |
| Risk-Free Cash | SHY | -7% |