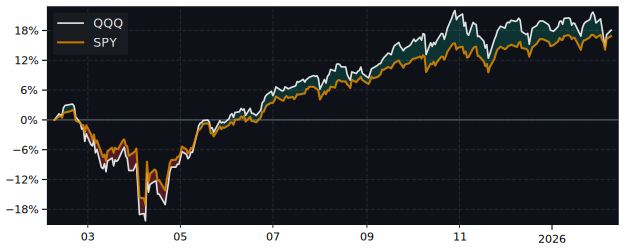
QQQ Performance: 38.7% Return (12 Months)
QQQ returned 38.7% over 12 months, outperforming the S&P 500 (31.5%). Volatility: 21.6%.
| P/E Trailing | - |
| P/E Forward | - |
| 52 Week High | 634.15 USD |
| 52 Week Low | 414.06 USD |
| VRO Trend Strength ±100 | 17.46 |
| Buy Signal ±3 | 0.04 |
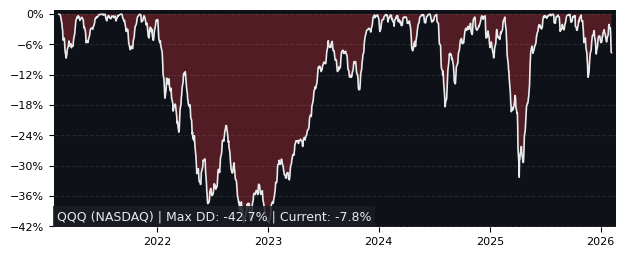
| Max Drawdown | 22.77% |
| Mean Drawdown | 3.14% |
Top Performer in Large Growth (5/36)
| SYMBOL | 1W | 1M | 3M |
|---|---|---|---|
| RPG | 7.59% | -1.20% | 0.62% |
| QQQE | 3.33% | -3.78% | -3.83% |
| QTOP | 5.42% | -3.34% | -5.20% |
| QQQ | 4.78% | -3.81% | -5.22% |
| FDMO | 5.13% | -2.25% | -5.36% |
| GRNY | 3.58% | -3.22% | -5.58% |
| SYMBOL | 6M | 12M | 5Y |
|---|---|---|---|
| GRNY | -5.88% | 47.03% | 18.98% |
| QTOP | -2.90% | 42.34% | 23.17% |
| GARP | -2.89% | 42.30% | 102.40% |
| STLG | -2.89% | 42.30% | 102.40% |
| RPG | -0.07% | 40.36% | 45.95% |
| QQQ | -3.49% | 38.74% | 82.08% |
| SYMBOL | MCAP | 1M | 12M | 5Y | P/E | P/E fwd | PEG | EPS stab | EPS cagr |
|---|---|---|---|---|---|---|---|---|---|
| RPG NYSE ARCA SP500 Pure Growth |
1.61B | -1.20% | 40.4% | 46.0% | - | - | - | - | - |
| CNEQ NYSE ARCA The Alger Trust |
395M | -4.10% | 54.4% | 58.2% | - | - | - | - | - |
| GARP BATS MSCI USA Quality GARP |
1.30B | -4.04% | 42.3% | 102% | - | - | - | - | - |
| STLG BATS Factors US Growth Style |
1.39B | -4.04% | 42.3% | 102% | - | - | - | - | - |
| SPUS NYSE ARCA SP Funds SP500 Sharia |
2.09B | -3.79% | 39.9% | 88.5% | - | - | - | - | - |
| FDMO NYSE ARCA Fidelity Momentum Factor |
737M | -2.25% | 38.8% | 84.2% | - | - | - | - | - |
| QQQM NASDAQ NASDAQ 100 |
69.8B | -3.80% | 38.8% | 82.7% | - | - | - | - | - |
| QTOP NASDAQ Nasdaq Top 30 Stocks |
220M | -3.34% | 42.3% | 23.2% | - | - | - | - | - |
| QQQ NASDAQ QQQ Trust |
376B | -3.81% | 38.7% | 82.1% | - | - | - | - | - |
| GRNY NYSE ARCA Fundstrat Granny Shots US |
3.86B | -3.22% | 47.0% | 19.0% | - | - | - | - | - |
Performance: QQQ vs S&P 500
| PERIOD | QQQ | S&P 500 | DIFFERENCE |
|---|---|---|---|
| 1 Month | -3.81% | -3.48% | -0.34% |
| 3 Months | -5.22% | -4.38% | -0.88% |
| 6 Months | -3.49% | -1.79% | -1.73% |
| 12 Months | 38.74% | 31.52% | 5.49% |
| 5 Years | 82.08% | 72.80% | 5.37% |
QQQ Performance FAQ
Does QQQ outperform the market?
Yes, QQQ significantly outperforms the market. Over the past 12 months, QQQ returned 38.74% compared to 31.52% for the S&P 500.
What is the QQQ return over the last 12 months?
QQQ has returned 38.74% over the past 12 months, including dividends. Over 3 months the return was -5.22%, and over 5 years 82.08%.
How risky is QQQ?
QQQ has relatively low risk with a maximum drawdown of 22.77% over the past 3 years. The average drawdown is 3.14%.
QQQ vs Sectors (12m)
Sorted by outperformance. Positive = QQQ beats sector.
| SECTOR | ETF | DIFFERENCE 12M |
|---|---|---|
| Consumer Staples | XLP | 30.2% |
| Health Care | XLV | 27.6% |
| Real Estate | XLRE | 25.5% |
| Financials | XLF | 24.7% |
| Consumer Discretionary | XLY | 18.1% |
| Communication Services | XLC | 9.3% |
| Communication Services | XLC | 9.3% |
| Materials | XLB | 4.6% |
| Industrials | XLI | -2.7% |
| Technology | XLK | -10.4% |
| Energy | XLE | -17.6% |
QQQ vs Asset Classes (12m)
| ASSET CLASS | ETF | DIFFERENCE 12M |
|---|---|---|
| S&P 500 | SPY | 5.49% |
| Gold | GLD | -18.2% |
| Long-Term Bonds | TLT | 38% |