AMPX Performance & Benchmarks - 484.2% in 12m
The Total Return for 3m is 215.8%, for 6m 109.9% and YTD 150.4%. Compare with Peer-Group: Electrical Components & Equipment
Performance Rating
-11.57%
#49 in Peer-Group
Rel. Strength
99.37%
#49 in Stock-Universe
Total Return 12m
484.17%
#2 in Peer-Group
Total Return 5y
-29.90%
#62 in Peer-Group
| P/E | Value |
|---|---|
| P/E Trailing | - |
| P/E Forward | - |
| High / Low | USD |
|---|---|
| 52 Week High | 8.66 USD |
| 52 Week Low | 0.71 USD |
| Sentiment | Value |
|---|---|
| VRO Trend Strength +-100 | 63.89 |
| Buy/Sell Signal +-5 | -0.68 |
| Support / Resistance | Levels |
|---|---|
| Support | |
| Resistance |
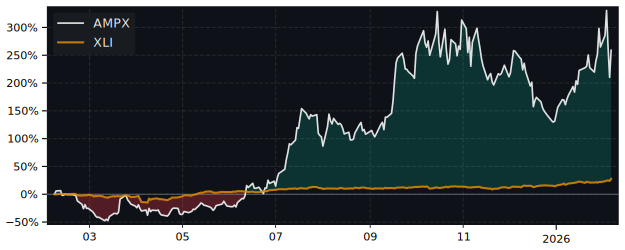
12m Total Return: AMPX (484.2%) vs XLI (22%)
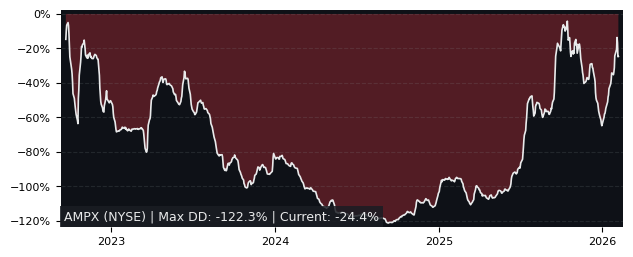
5y Drawdown (Underwater) Chart
Top Performer in Electrical Components & Equipment
Short Term Performance
| Symbol | 1w | 1m | 3m |
|---|---|---|---|
| AMPX | -12.7% | 66.5% | 216% |
| ELPW | 74.2% | 354% | 36.2% |
| STEM | -4.04% | 129% | 71.6% |
| EAF | 3.52% | 51.1% | 145% |
Long Term Performance
| Symbol | 6m | 12m | 5y |
|---|---|---|---|
| AMPX | 110% | 484% | -29.9% |
| INT | 235% | 332% | 2,830% |
| EAF | 1.38% | 88.4% | -76.4% |
| AMSC | 60.9% | 90.1% | 354% |
Overall best picks of Peer Group - Selected by proven GARP Predictive Metrics, sorted by Growth Rating
| Symbol | 1m | 12m | 5y | P/E | P/E Forward | PEG | EPS Stability | EPS CAGR |
|---|---|---|---|---|---|---|---|---|
| RBC NYSE RBC Bearings |
0.02% | 32% | 224% | 51.1 | 14.5 | 1.45 | 87.6% | 27.9% |
| EMR NYSE Emerson Electric |
9.55% | 28.5% | 160% | 41.7 | 22 | 1.8 | -35.5% | -17.7% |
| NVT NYSE nVent Electric |
7.75% | 14.5% | 367% | 53.5 | 24.7 | 1.09 | -7.10% | 65.1% |
| POWL NASDAQ Powell Industries |
9.59% | 74% | 851% | 16.9 | 15.8 | 1.13 | 77.6% | 71.2% |
| VRT NYSE Vertiv Holdings |
12.3% | 97.7% | 865% | 76.1 | 36.9 | 1.03 | 88.5% | 103% |
| LYTS NASDAQ LSI Industries |
7.17% | 13.7% | 235% | 24.3 | 17.4 | 0.39 | -36.3% | -10.3% |
| AYI NYSE Acuity Brands |
5.77% | 26.9% | 222% | 23.8 | 14.8 | 1.44 | 61.2% | 9.03% |
| NKT CO NKT |
13.4% | -3.81% | 286% | 17.2 | 37.6 | 0.01 | 83.5% | 235% |
Performance Comparison: AMPX vs XLI vs S&P 500
XLI (Industrial Sector SPDR ETF) is the Sector Benchmark for AMPX
| Total Return (including Dividends) | AMPX | XLI | S&P 500 |
|---|---|---|---|
| 1 Month | 66.51% | 3.04% | 2.69% |
| 3 Months | 215.77% | 17.03% | 14.80% |
| 12 Months | 484.17% | 21.95% | 18.52% |
| 5 Years | -29.90% | 127.90% | 107.25% |
| Trend Stabilty (consistency of price movement) | AMPX | XLI | S&P 500 |
|---|---|---|---|
| 1 Month | 78.5% | 91% | 91.2% |
| 3 Months | 95.7% | 93.8% | 97.5% |
| 12 Months | 83.2% | 56.8% | 49.7% |
| 5 Years | -69.8% | 87.2% | 84% |
| Relative Strength (compared with Indexes) | Rank in Peer Group | vs. XLI | vs. S&P 500 |
|---|---|---|---|
| 1 Month | 96 %th | 61.60% | 62.15% |
| 3 Month | 100 %th | 169.82% | 175.06% |
| 12 Month | 99 %th | 379.04% | 392.89% |
| 5 Years | 45 %th | -59.95% | -58.69% |
FAQs
Does Amprius Technologies (AMPX) outperform the market?
Yes,
over the last 12 months AMPX made 484.17%, while its related Sector, the Industrial Sector SPDR (XLI) made 21.95%.
Over the last 3 months AMPX made 215.77%, while XLI made 17.03%.
Performance Comparison AMPX vs Indeces and Sectors
Above 0 means better perfomance compared to Symbol in this Timeframe
AMPX vs. Indices
| Symbol | 1w | 1m | 6m | 12m | |
|---|---|---|---|---|---|
| US S&P 500 | SPY | -12.7% | 63.8% | 104.4% | 466% |
| US NASDAQ 100 | QQQ | -13.5% | 63.5% | 101% | 459% |
| German DAX 40 | DAX | -12.9% | 65.1% | 98.7% | 453% |
| Shanghai Shenzhen CSI 300 | CSI 300 | -12% | 61.5% | 100.2% | 459% |
| Hongkong Hang Seng | HSI | -13.3% | 61.1% | 81.9% | 441% |
| India NIFTY 50 | INDA | -9% | 71.9% | 106.5% | 491% |
| Brasil Bovespa | EWZ | -10.5% | 73.3% | 102% | 480% |
AMPX vs. Sectors
| Symbol | 1w | 1m | 6m | 12m | |
|---|---|---|---|---|---|
| Communication Services | XLC | -10.9% | 68.4% | 104.9% | 457% |
| Consumer Discretionary | XLY | -11.2% | 63.8% | 113.7% | 462% |
| Consumer Staples | XLP | -11.3% | 67.1% | 107.7% | 478% |
| Energy | XLE | -13.7% | 63.1% | 111.1% | 487% |
| Financial | XLF | -12% | 65.9% | 107.4% | 462% |
| Health Care | XLV | -11.2% | 67% | 118% | 493% |
| Industrial | XLI | -11.6% | 63.5% | 100.1% | 462% |
| Materials | XLB | -9% | 65.3% | 109.6% | 485% |
| Real Estate | XLRE | -11.1% | 64.8% | 106.8% | 479% |
| Technology | XLK | -14.4% | 62% | 95.5% | 457% |
| Utilities | XLU | -13.7% | 62.2% | 99.6% | 462% |
| Aerospace & Defense | XAR | -11.7% | 62.8% | 85% | 436% |
| Biotech | XBI | -10.5% | 62.5% | 117.7% | 497% |
| Homebuilder | XHB | -8.3% | 62.1% | 116.7% | 496% |
| Retail | XRT | -8.5% | 63.5% | 112.2% | 481% |
AMPX vs. Commodities
| Symbol | 1w | 1m | 6m | 12m | |
|---|---|---|---|---|---|
| Oil | USO | -20.4% | 55.7% | 106% | 475% |
| Natural Gas | UNG | -10.1% | 79.1% | 127.2% | 489% |
| Gold | GLD | -9.1% | 67.8% | 93.3% | 449% |
| Silver | SLV | -6.6% | 64.4% | 93.2% | 454% |
| Copper | CPER | 9.1% | 77.3% | 105.9% | 474% |
AMPX vs. Bonds
| Symbol | 1w | 1m | 6m | 12m | |
|---|---|---|---|---|---|
| iShares 20+ Years Bond | TLT | -13.7% | 67.7% | 109.4% | 488% |
| iShares High Yield Corp. Bond | HYG | -12.4% | 66.4% | 106.4% | 475% |