NBR Performance: 204.7% Return (12 Months)
NBR returned 204.7% over 12 months, outperforming the S&P 500 (37.7%). Volatility: 55.5%.
| P/E Trailing | 4.60 |
| P/E Forward | 133 |
| 52 Week High | 89.60 USD |
| 52 Week Low | 24.60 USD |
| VRO Trend Strength ±100 | 55.34 |
| Buy Signal ±3 | 0.32 |
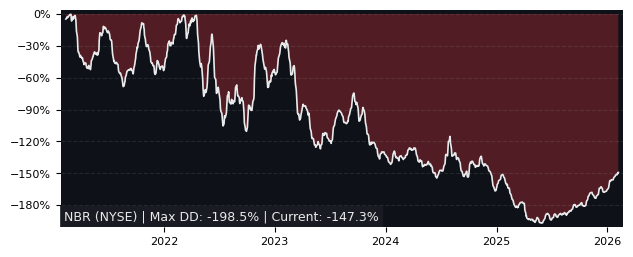
| Max Drawdown | 82.22% |
| Mean Drawdown | 47.37% |
Top Performer in Oil & Gas Drilling (5/9)
| SYMBOL | 1W | 1M | 3M |
|---|---|---|---|
| VAL | 3.72% | 10.09% | 87.56% |
| NE | 3.75% | 10.69% | 68.36% |
| RIG | 3.08% | 8.59% | 56.91% |
| PTEN | -0.19% | 11.43% | 48.69% |
| SDRL | 8.39% | 11.57% | 37.76% |
| NBR | 5.46% | 3.13% | 29.32% |
| SYMBOL | 6M | 12M | 5Y |
|---|---|---|---|
| VAL | 94.68% | 245.44% | 321.81% |
| RIG | 97.06% | 205.94% | 114.06% |
| NBR | 93.99% | 204.70% | -0.89% |
| NE | 74.42% | 196.23% | 140.14% |
| SDRL | 55.96% | 155.96% | 45.48% |
| PDS | 63.58% | 145.11% | 274.76% |
| SYMBOL | MCAP | 1M | 12M | 5Y | P/E | P/E fwd | PEG | EPS stab | EPS cagr |
|---|---|---|---|---|---|---|---|---|---|
| VAL NYSE Valaris |
6.79B | 10.1% | 245% | 322% | 7.07 | 31.6 | - | 54.3% | 254% |
| NBR NYSE Nabors Industries |
1.17B | 3.13% | 205% | -0.89% | 4.60 | 133 | 2.90 | 39.6% | 133% |
Performance: NBR vs S&P 500
| PERIOD | NBR | S&P 500 |
|---|---|---|
| 1 Week | 5.46% | 3.17% |
| 1 Month | 3.13% | -0.06% |
| 3 Months | 29.32% | -1.69% |
| 6 Months | 93.99% | 1.00% |
| 12 Months | 204.70% | 37.72% |
| 5 Years | -0.89% | 75.84% |
NBR Performance FAQ
Does NBR outperform the market?
Yes, NBR significantly outperforms the market. Over the past 12 months, NBR returned 204.70% compared to 37.72% for the S&P 500.
What is the NBR return over the last 12 months?
NBR has returned 204.70% over the past 12 months, including dividends. Over 3 months the return was 29.32%, and over 5 years -0.89%.
How risky is NBR?
NBR has relatively low risk with a maximum drawdown of 82.22% over the past 3 years. The average drawdown is 47.37%.
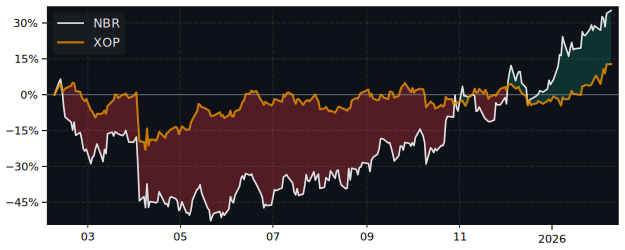
NBR vs Sectors (12m)
Sorted by outperformance. Positive = NBR beats sector.
| SECTOR | ETF | DIFFERENCE 12M |
|---|---|---|
| Consumer Staples | XLP | 193.3% |
| Health Care | XLV | 190.1% |
| Financials | XLF | 186.3% |
| Real Estate | XLRE | 186.3% |
| Consumer Discretionary | XLY | 178% |
| Consumer Discretionary | XLY | 178% |
| Communication Services | XLC | 170.9% |
| Materials | XLB | 162.6% |
| Industrials | XLI | 156.3% |
| Energy | XLE | 147.9% |
| Technology | XLK | 146.1% |
NBR vs Asset Classes (12m)
| ASSET CLASS | ETF | DIFFERENCE 12M |
|---|---|---|
| S&P 500 | SPY | 167% |
| Emerging Market | EEM | 144% |
| Gold | GLD | 146.8% |
| Long-Term Bonds | TLT | 201.9% |
| Risk-Free Cash | SHY | 201.2% |