ETH Performance & Benchmarks - 52.2% in 12m
The Total Return for 3m is 101.8%, for 6m 34.1% and YTD 9.7%. Compare with Peer-Group: Digital Assets
Performance Rating
1.19%
#105 in Peer-Group
Rel. Strength
82.75%
#1328 in Stock-Universe
Total Return 12m
52.20%
#93 in Peer-Group
Total Return 5y
5.66%
#99 in Peer-Group
| P/E | Value |
|---|---|
| P/E Trailing | - |
| P/E Forward | - |
| High / Low | USD |
|---|---|
| 52 Week High | 38.26 USD |
| 52 Week Low | 13.77 USD |
| Sentiment | Value |
|---|---|
| VRO Trend Strength +-100 | 64.79 |
| Buy/Sell Signal +-5 | 0.97 |
| Support / Resistance | Levels |
|---|---|
| Support | |
| Resistance |
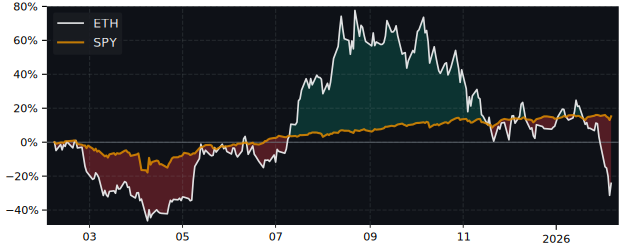
12m Total Return: ETH (52.2%) vs SPY (23.5%)
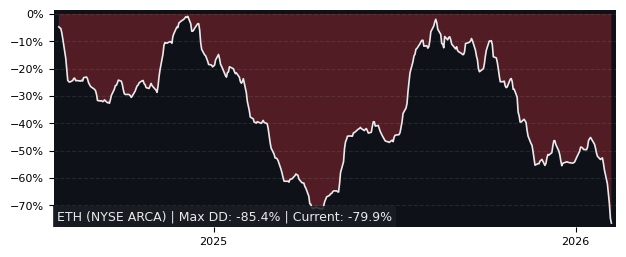
5y Drawdown (Underwater) Chart
Top Performer in Digital Assets
Short Term Performance
| Symbol | 1w | 1m | 3m |
|---|---|---|---|
| ETH | -3.44% | 44.1% | 102% |
| ETHU | -7.75% | 97.8% | 241% |
| VETH | -3.64% | 48.8% | 98.5% |
| ZETH | -3.72% | 48.5% | 97.3% |
Long Term Performance
| Symbol | 6m | 12m | 5y |
|---|---|---|---|
| ETH | 34.1% | 52.2% | 5.66% |
| XRRL | 2.82% | 482% | 252% |
| ETHU | 22.8% | 7.45% | -63.0% |
| BITU | 13.7% | 209% | 69.5% |
Overall best picks of Peer Group - Selected by proven GARP Predictive Metrics, sorted by Growth Rating
| Symbol | 1m | 12m | 5y | P/E | P/E Forward | PEG | EPS Stability | EPS CAGR |
|---|---|---|---|---|---|---|---|---|
| 2BTC XETRA 21Shares Bitcoin ETP |
8.42% | 95.5% | 818% | - | - | - | - | - |
| BTCE XETRA BTCetc - Bitcoin Exchange |
8.41% | 95.5% | 794% | - | - | - | - | - |
| GBTC NYSE ARCA Grayscale Bitcoin Trust |
6.1% | 112% | 601% | - | - | - | - | - |
| 21BC XETRA 21Shares Bitcoin Core ETP |
8.47% | 97.6% | 315% | - | - | - | - | - |
| VBTC XETRA VanEck Vectors Bitcoin ETN |
8.41% | 97.2% | 489% | - | - | - | - | - |
| MAXI NASDAQ Simplify Bitcoin Strategy |
3.46% | 99.4% | 410% | - | - | - | - | - |
| FBTC XETRA Fidelity Physical Bitcoin |
8.51% | 99.1% | 150% | - | - | - | - | - |
| BITC XETRA CoinShares Physical Bitcoin |
8.41% | 98.1% | 225% | - | - | - | - | - |
Performance Comparison: ETH vs SPY vs S&P 500
SPY (SPDR SP500 Trust ETF) is the Sector Benchmark for ETH
| Total Return (including Dividends) | ETH | SPY | S&P 500 |
|---|---|---|---|
| 1 Month | 44.08% | 1.69% | 1.69% |
| 3 Months | 101.81% | 12.34% | 12.34% |
| 12 Months | 52.20% | 23.51% | 23.51% |
| 5 Years | 5.66% | 102.76% | 102.76% |
| Trend Stabilty (consistency of price movement) | ETH | SPY | S&P 500 |
|---|---|---|---|
| 1 Month | 83% | 68.6% | 68.6% |
| 3 Months | 68.7% | 96.5% | 96.5% |
| 12 Months | -6.6% | 50.2% | 50.2% |
| 5 Years | -11% | 84% | 84% |
| Relative Strength (compared with Indexes) | Rank in Peer Group | vs. SPY | vs. S&P 500 |
|---|---|---|---|
| 1 Month | 86 %th | 41.68% | 41.68% |
| 3 Month | 92 %th | 79.64% | 79.64% |
| 12 Month | 36 %th | 23.23% | 23.23% |
| 5 Years | 42 %th | -8.44% | -8.44% |
FAQs
Does Grayscale Ethereum (ETH) outperform the market?
Yes,
over the last 12 months ETH made 52.20%, while its related Sector, the SPDR SP500 Trust (SPY) made 23.51%.
Over the last 3 months ETH made 101.81%, while SPY made 12.34%.
Performance Comparison ETH vs Indeces and Sectors
Above 0 means better perfomance compared to Symbol in this Timeframe
ETH vs. Indices
| Symbol | 1w | 1m | 6m | 12m | |
|---|---|---|---|---|---|
| US S&P 500 | SPY | -2.5% | 42.4% | 28.6% | 29% |
| US NASDAQ 100 | QQQ | -2.7% | 41.9% | 26.2% | 22% |
| German DAX 40 | DAX | -2.6% | 45.4% | 24.1% | 16% |
| Shanghai Shenzhen CSI 300 | CSI 300 | -2.1% | 40.8% | 25.6% | 30% |
| Hongkong Hang Seng | HSI | -1.5% | 39.8% | 5.8% | 11% |
| India NIFTY 50 | INDA | -2% | 49.3% | 32% | 56% |
| Brasil Bovespa | EWZ | -5% | 49.9% | 26.3% | 45% |
ETH vs. Sectors
| Symbol | 1w | 1m | 6m | 12m | |
|---|---|---|---|---|---|
| Communication Services | XLC | -4.5% | 43% | 29% | 19% |
| Consumer Discretionary | XLY | -0.1% | 44% | 39.3% | 23% |
| Consumer Staples | XLP | -3.3% | 46% | 30.4% | 46% |
| Energy | XLE | -0.4% | 45% | 37.7% | 50% |
| Financial | XLF | -1.3% | 45.5% | 31.9% | 23% |
| Health Care | XLV | -1.8% | 45.1% | 42.8% | 60% |
| Industrial | XLI | -1.3% | 42.6% | 23.1% | 25% |
| Materials | XLB | 0% | 47% | 34.5% | 50% |
| Real Estate | XLRE | -2.5% | 43.7% | 31.8% | 46% |
| Technology | XLK | -2.8% | 41.2% | 20.1% | 19% |
| Utilities | XLU | -7.9% | 37.6% | 20% | 28% |
| Aerospace & Defense | XAR | -1.9% | 40.7% | 9.7% | -3% |
| Biotech | XBI | -3.7% | 40.2% | 40.3% | 59% |
| Homebuilder | XHB | -2.6% | 39.6% | 34.3% | 53% |
| Retail | XRT | -0.8% | 44.6% | 33.9% | 41% |
ETH vs. Commodities
| Symbol | 1w | 1m | 6m | 12m | |
|---|---|---|---|---|---|
| Oil | USO | -2.1% | 44.6% | 35.9% | 48% |
| Natural Gas | UNG | 1.8% | 58.3% | 58.2% | 52% |
| Gold | GLD | -5.2% | 42.9% | 15.6% | 12% |
| Silver | SLV | -1.5% | 42.4% | 17.8% | 16% |
| Copper | CPER | 16.9% | 55.1% | 33.2% | 42% |
ETH vs. Bonds
| Symbol | 1w | 1m | 6m | 12m | |
|---|---|---|---|---|---|
| iShares 20+ Years Bond | TLT | -6.4% | 41.5% | 32.3% | 59% |
| iShares High Yield Corp. Bond | HYG | -3.7% | 43.4% | 30.2% | 42% |