(RSPS) Performance 1.9% Return (12 Months)
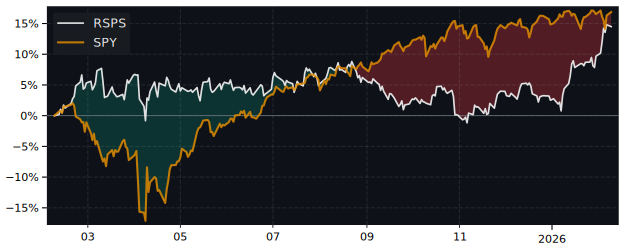
RSPS returned 1.9% over 12 months, underperforming the S&P 500 (28.9%). Volatility: 13.1%.
| P/E Trailing | - |
| P/E Forward | - |
| 52 Week High | 33.00 USD |
| 52 Week Low | 27.78 USD |
| VRO Trend Strength ±100 | 59.37 |
| Buy Signal ±3 | 0.25 |
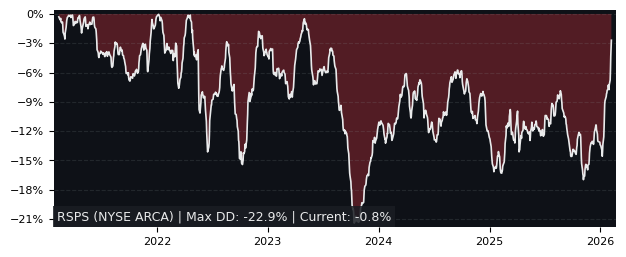
| Max Drawdown | 16.53% |
| Median Drawdown | 6.90% |
Detailed Performance Metrics Updated: 2026-05-22 03:56
| CAGR | -0.9% |
| CAGR / Max DD | -0.05 |
| CAGR / Mean DD | -0.13 |
| CAGR / Median DD | -0.13 |
| ATR % | 1.36% |
| Beta | 0.127 |
| Beta Downside | 0.193 |
| Alpha | -6.97% |
| CAPM | 6.43% |
| Current Price | 29.87 USD | |
| SMA 20 | 29.74 USD | -0.44% |
| SMA 50 | 29.61 USD | -0.87% |
| SMA 200 | 29.73 USD | -0.47% |
| RSI 14 | 52.7 |
| EMA8 Dist. Percentile | 47.3% |
| Distance to 52W High | -9.48% |
| Hurst Exponent | 0.608 |
29.3 (1.19) | 30 (0.98)
2025-11-06: 28.21 | 2025-12-15: 30.19 (+7.02%) | 2026-01-08: 28.51 (-5.56%) | 2026-02-12: 33.37 (+17.05%) | 2026-03-25: 28.9 (-13.4%) | 2026-05-19: 30.25 (+4.67%)
2026-01-07 | 2026-02-27 | 2026-03-20
-
| METRIC | RSPS | PERCENTILE RANK |
|---|---|---|
| RS IBD | 25.11 | 7.1 |
| Performance 1M | 1.63% | 7.1 |
| Performance 3M | -8.69% | 7.1 |
| Performance 6M | 4.20% | 7.1 |
| Performance 12M | 1.89% | 7.1 |
| Sharpe Ratio | -0.11 | 21.4 |
Top Performer in Consumer Defensive (5/7)
| SYMBOL | 1W | 1M | 3M |
|---|---|---|---|
| VDC | -0.94% | 1.89% | -4.14% |
| FSTA | -0.93% | 1.87% | -4.22% |
| XLP | -0.38% | 3.45% | -4.31% |
| IYK | 0.01% | 5.03% | -4.84% |
| KXI | 0.19% | 3.35% | -5.23% |
| RSPS | 0.61% | 1.63% | -8.69% |
| SYMBOL | 6M | 12M | 5Y |
|---|---|---|---|
| XLP | 10.17% | 6.57% | 35.57% |
| KXI | 7.54% | 6.46% | 24.97% |
| VDC | 9.62% | 6.41% | 39.45% |
| FSTA | 9.57% | 6.13% | 38.99% |
| IYK | 7.05% | 5.55% | 36.45% |
| RSPS | 4.20% | 1.89% | 2.95% |
Overall Best Picks of Peer Group (GARP Metrics)
| SYMBOL | MCAP | 1M | 12M | 5Y | P/E | P/E fwd | PEG | EPS stab | EPS cagr |
|---|---|---|---|---|---|---|---|---|---|
| KXI NYSE ARCA Global Consumer Staples |
1.03B | 3.35% | 6.46% | 25.0% | - | - | - | - | - |
| IYK NYSE ARCA US Consumer Staples |
1.58B | 5.03% | 5.55% | 36.5% | - | - | - | - | - |
| XLP NYSE ARCA Consumer Staples Sector Fund |
15.2B | 3.45% | 6.57% | 35.6% | - | - | - | - | - |
| VDC NYSE ARCA Consumer Staples Shares |
8.05B | 1.89% | 6.41% | 39.5% | - | - | - | - | - |
| FSTA NYSE ARCA Fidelity MSCI Consumer |
1.43B | 1.87% | 6.13% | 39.0% | - | - | - | - | - |
| RSPS NYSE ARCA SP500 Equal Weight Consumer |
235M | 1.63% | 1.89% | 2.95% | - | - | - | - | - |
| RHS NYSE ARCA SP500 Equal Weight Consumer |
235M | 1.75% | 2.0% | 3.06% | - | - | - | - | - |
Compare RSPS vs S&P 500
| PERIOD | RSPS | S&P 500 |
|---|---|---|
| 1 Week | 0.61% | -0.73% |
| 1 Month | 1.63% | 5.49% |
| 3 Months | -8.69% | 9.14% |
| 6 Months | 4.20% | 13.34% |
| 12 Months | 1.89% | 28.89% |
| 5 Years | 2.95% | 89.72% |
FAQ
Does RSPS outperform the market?
No, RSPS underperforms the market. Over the past 12 months, RSPS returned 1.89% compared to 28.89% for the S&P 500.
What is the RSPS return over the last 12 months?
RSPS has returned 1.89% over the past 12 months, including dividends. Over 3 months the return was -8.69%, and over 5 years 2.95%.
How risky is RSPS?
RSPS has relatively low risk with a maximum drawdown of 16.53% over the past 3 years. The average drawdown is 6.72%.
RSPS vs Sectors (12m)
| SECTOR | ETF | DIFFERENCE 12M |
|---|---|---|
| Financials | XLF | -2.6% |
| Consumer Staples | XLP | -4.7% |
| Real Estate | XLRE | -11.1% |
| Consumer Discretionary | XLY | -11.2% |
| Consumer Discretionary | XLY | -11.2% |
| Health Care | XLV | -12.7% |
| Communication Services | XLC | -14.6% |
| Materials | XLB | -16.8% |
| Industrials | XLI | -20.4% |
| Energy | XLE | -46.9% |
| Technology | XLK | -54.8% |
RSPS vs Asset Classes (12m)
| ASSET CLASS | ETF | DIFFERENCE 12M |
|---|---|---|
| S&P 500 | SPY | -27% |
| Emerging Market | EEM | -44.5% |
| Gold | GLD | -34.5% |
| Long-Term Bonds | TLT | -3% |
| Risk-Free Cash | SHY | -1.6% |