RYLD Performance & Benchmarks - 1.9% in 12m
The Total Return for 3m is 2.7%, for 6m -6.6% and YTD -5%. Compare with Peer-Group: Derivative Income
Performance Rating
13.40%
#91 in Peer-Group
Rel. Strength
44.87%
#4238 in Stock-Universe
Total Return 12m
1.94%
#91 in Peer-Group
Total Return 5y
28.90%
#43 in Peer-Group
| P/E | Value |
|---|---|
| P/E Trailing | - |
| P/E Forward | - |
| High / Low | USD |
|---|---|
| 52 Week High | 15.86 USD |
| 52 Week Low | 12.84 USD |
| Sentiment | Value |
|---|---|
| VRO Trend Strength +-100 | 7.14 |
| Buy/Sell Signal +-5 | -0.73 |
| Support / Resistance | Levels |
|---|---|
| Support | |
| Resistance |
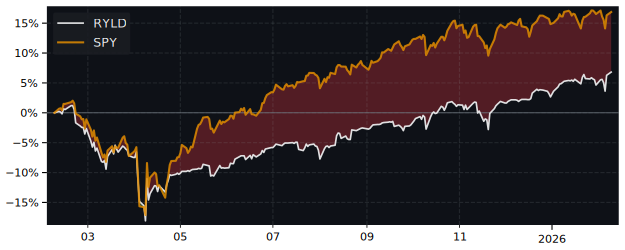
12m Total Return: RYLD (1.9%) vs SPY (15.9%)
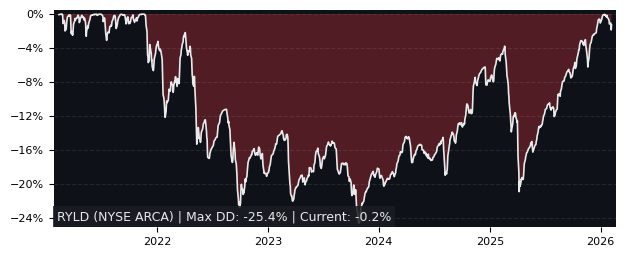
5y Drawdown (Underwater) Chart
Top Performer in Derivative Income
Short Term Performance
| Symbol | 1w | 1m | 3m |
|---|---|---|---|
| RYLD | -2.49% | -2.03% | 2.65% |
| AMDY | 1.64% | 18.2% | 53.1% |
| NVDY | -0.12% | 10.1% | 42.9% |
| TSMY | -2.75% | 3.20% | 29.8% |
Long Term Performance
| Symbol | 6m | 12m | 5y |
|---|---|---|---|
| RYLD | -6.55% | 1.94% | 28.9% |
| NVDY | 36.7% | 38.1% | 254% |
| AMDY | 30.4% | 20.9% | 29.6% |
| SNOY | 13.2% | 58.7% | 53.7% |
Overall best picks of Peer Group - Selected by proven GARP Predictive Metrics, sorted by Growth Rating
| Symbol | 1m | 12m | 5y | P/E | P/E Forward | PEG | EPS Stability | EPS CAGR |
|---|---|---|---|---|---|---|---|---|
| DIVO NYSE ARCA Amplify CWP Enhanced |
-0.37% | 13.7% | 85.1% | - | - | - | - | - |
| SIXH NYSE ARCA ETC 6 Meridian Hedged |
-0.05% | 8.15% | 64.9% | - | - | - | - | - |
| FTHI NASDAQ First Trust BuyWrite Income |
1.06% | 11.1% | 66.4% | - | - | - | - | - |
| XYLG NYSE ARCA Global X SP500 Covered |
0.54% | 12.8% | 72.8% | - | - | - | - | - |
| JEPI NYSE ARCA JPMorgan Equity Premium |
-2.06% | 5.39% | 60.9% | - | - | - | - | - |
| BUYW BATS Main Buywrite |
0.57% | 9.13% | 31.7% | - | - | - | - | - |
| PUTW NYSE ARCA WisdomTree CBOE SP500 |
0.84% | 6.32% | 65.7% | - | - | - | - | - |
| HYGW BATS iShares Trust - iShares |
0.49% | 4.76% | 17.7% | - | - | - | - | - |
Performance Comparison: RYLD vs SPY vs S&P 500
SPY (SPDR SP500 Trust ETF) is the Sector Benchmark for RYLD
| Total Return (including Dividends) | RYLD | SPY | S&P 500 |
|---|---|---|---|
| 1 Month | -2.03% | 0.66% | 0.66% |
| 3 Months | 2.65% | 11.66% | 11.66% |
| 12 Months | 1.94% | 15.92% | 15.92% |
| 5 Years | 28.90% | 103.09% | 103.09% |
| Trend Stabilty (consistency of price movement) | RYLD | SPY | S&P 500 |
|---|---|---|---|
| 1 Month | -54.9% | 66.4% | 66.4% |
| 3 Months | 88% | 96.6% | 96.6% |
| 12 Months | -4% | 50% | 50% |
| 5 Years | 9.4% | 84% | 84% |
| Relative Strength (compared with Indexes) | Rank in Peer Group | vs. SPY | vs. S&P 500 |
|---|---|---|---|
| 1 Month | 14 %th | -2.67% | -2.67% |
| 3 Month | 23 %th | -8.07% | -8.07% |
| 12 Month | 13 %th | -12.06% | -12.06% |
| 5 Years | 5 %th | -36.53% | -36.53% |
FAQs
Does Global X Russell 2000 (RYLD) outperform the market?
No,
over the last 12 months RYLD made 1.94%, while its related Sector, the SPDR SP500 Trust (SPY) made 15.92%.
Over the last 3 months RYLD made 2.65%, while SPY made 11.66%.
Performance Comparison RYLD vs Indeces and Sectors
Above 0 means better perfomance compared to Symbol in this Timeframe
RYLD vs. Indices
| Symbol | 1w | 1m | 6m | 12m | |
|---|---|---|---|---|---|
| US S&P 500 | SPY | -0.1% | -2.7% | -11.2% | -14% |
| US NASDAQ 100 | QQQ | -0.3% | -3.3% | -13.7% | -19% |
| German DAX 40 | DAX | 0.8% | -1% | -15.5% | -27% |
| Shanghai Shenzhen CSI 300 | CSI 300 | 0.1% | -4.7% | -15.5% | -19% |
| Hongkong Hang Seng | HSI | -0.3% | -4.1% | -33.9% | -37% |
| India NIFTY 50 | INDA | -0.5% | 3.6% | -10.1% | 8% |
| Brasil Bovespa | EWZ | -1.4% | 5.4% | -13.5% | -2% |
RYLD vs. Sectors
| Symbol | 1w | 1m | 6m | 12m | |
|---|---|---|---|---|---|
| Communication Services | XLC | -1.1% | -0.5% | -10.5% | -23% |
| Consumer Discretionary | XLY | 1.4% | -1% | -1.3% | -17% |
| Consumer Staples | XLP | -0.9% | 0.2% | -8.9% | -3% |
| Energy | XLE | -0.8% | -2.2% | -5.2% | 5% |
| Financial | XLF | 1.3% | 0.4% | -7.5% | -19% |
| Health Care | XLV | 1.4% | 2.1% | 3.7% | 14% |
| Industrial | XLI | 0.9% | -3.2% | -16.5% | -19% |
| Materials | XLB | 3.6% | 1.7% | -5.1% | 6% |
| Real Estate | XLRE | 1% | -1.1% | -8% | -0% |
| Technology | XLK | -0.6% | -4.5% | -19.8% | -21% |
| Utilities | XLU | -4% | -6.7% | -17.7% | -17% |
| Aerospace & Defense | XAR | 0.3% | -6.1% | -29.3% | -44% |
| Biotech | XBI | -0.6% | -5.5% | -0.6% | 15% |
| Homebuilder | XHB | 0% | -3.2% | -5.3% | 10% |
| Retail | XRT | 2.3% | -0.1% | -5.8% | -1% |
RYLD vs. Commodities
| Symbol | 1w | 1m | 6m | 12m | |
|---|---|---|---|---|---|
| Oil | USO | -6% | -6.80% | -6.09% | 0% |
| Natural Gas | UNG | -1% | 7.8% | 16.2% | -2% |
| Gold | GLD | -3.1% | -2.5% | -25.5% | -35% |
| Silver | SLV | 0.6% | -4.7% | -23.7% | -27% |
| Copper | CPER | 20.6% | 10.6% | -8.1% | -6% |
RYLD vs. Bonds
| Symbol | 1w | 1m | 6m | 12m | |
|---|---|---|---|---|---|
| iShares 20+ Years Bond | TLT | -4.1% | -1.7% | -8% | 6% |
| iShares High Yield Corp. Bond | HYG | -1.9% | -1.8% | -9.9% | -6% |