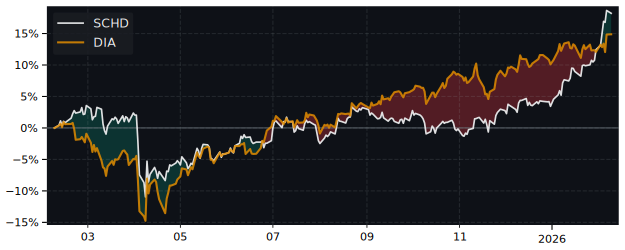
SCHD Performance: 27.3% Return (12 Months)
SCHD returned 27.3% over 12 months, in line with the S&P 500 (31.5%). Volatility: 11.7%.
| P/E Trailing | - |
| P/E Forward | - |
| 52 Week High | 31.59 USD |
| 52 Week Low | 23.42 USD |
| VRO Trend Strength ±100 | 35.13 |
| Buy Signal ±3 | 0.10 |
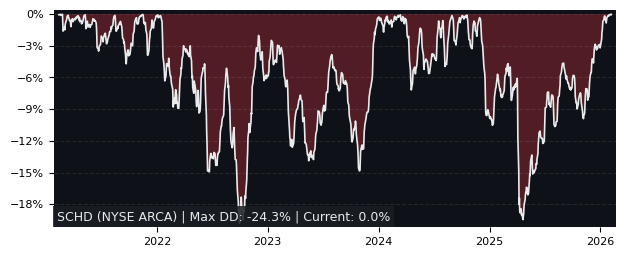
| Max Drawdown | 16.13% |
| Mean Drawdown | 3.47% |
Top Performer in Large Value (5/43)
| SYMBOL | 1W | 1M | 3M |
|---|---|---|---|
| FDL | -0.43% | 0.78% | 12.48% |
| SCHD | 0.26% | -1.41% | 10.42% |
| HDV | -1.03% | -1.24% | 10.19% |
| AVLV | 2.70% | -1.07% | 4.34% |
| VLUE | 4.87% | -1.21% | 3.81% |
| DFLV | 2.28% | -1.01% | 2.51% |
| SYMBOL | 6M | 12M | 5Y |
|---|---|---|---|
| VLUE | 15.34% | 55.53% | 58.29% |
| AVLV | 12.13% | 41.40% | 70.25% |
| PVAL | 8.91% | 38.01% | 94.73% |
| FDL | 18.04% | 34.54% | 90.70% |
| DFUV | 8.74% | 34.40% | 55.51% |
| SCHD | 13.88% | 27.27% | 47.48% |
| SYMBOL | MCAP | 1M | 12M | 5Y | P/E | P/E fwd | PEG | EPS stab | EPS cagr |
|---|---|---|---|---|---|---|---|---|---|
| VLUE BATS MSCI USA Value Factor |
9.94B | -1.21% | 55.5% | 58.3% | - | - | - | - | - |
| FDL NYSE ARCA Morningstar Dividend Leaders |
7.31B | 0.78% | 34.5% | 90.7% | - | - | - | - | - |
| AVLV NYSE ARCA American Century Trust |
10.5B | -1.07% | 41.4% | 70.3% | - | - | - | - | - |
| HDV NYSE ARCA Core High Dividend |
13.4B | -1.24% | 25.8% | 66.9% | - | - | - | - | - |
| DFLV NYSE ARCA Dimensional Trust |
5.29B | -1.01% | 33.7% | 53.5% | - | - | - | - | - |
| FNDX NYSE ARCA Schwab Fundamental U.S. |
23.3B | -1.64% | 34.4% | 75.4% | - | - | - | - | - |
| PVAL NYSE ARCA Putnam Focused Large Cap |
8.61B | -1.42% | 38.0% | 94.7% | - | - | - | - | - |
| FNDB NYSE ARCA Schwab Fundamental U.S. |
1.12B | -1.77% | 34.3% | 72.1% | - | - | - | - | - |
| VYM NYSE ARCA High Dividend Yield Shares |
71.3B | -2.03% | 30.7% | 67.6% | - | - | - | - | - |
| BKDV NYSE ARCA BNY Mellon Trust II |
1.09B | -1.75% | 32.0% | 20.5% | - | - | - | - | - |
Performance: SCHD vs S&P 500
| PERIOD | SCHD | S&P 500 | DIFFERENCE |
|---|---|---|---|
| 1 Month | -1.41% | -3.48% | 2.14% |
| 3 Months | 10.42% | -4.38% | 15.47% |
| 6 Months | 13.88% | -1.79% | 15.96% |
| 12 Months | 27.27% | 31.52% | -3.23% |
| 5 Years | 47.48% | 72.80% | -14.65% |
SCHD Performance FAQ
Does SCHD outperform the market?
SCHD performs roughly in line with the market. Over the past 12 months, SCHD returned 27.27% compared to 31.52% for the S&P 500.
What is the SCHD return over the last 12 months?
SCHD has returned 27.27% over the past 12 months, including dividends. Over 3 months the return was 10.42%, and over 5 years 47.48%.
How risky is SCHD?
SCHD has relatively low risk with a maximum drawdown of 16.13% over the past 3 years. The average drawdown is 3.47%.
SCHD vs Sectors (12m)
Sorted by outperformance. Positive = SCHD beats sector.
| SECTOR | ETF | DIFFERENCE 12M |
|---|---|---|
| Consumer Staples | XLP | 18.8% |
| Health Care | XLV | 16.2% |
| Real Estate | XLRE | 14% |
| Financials | XLF | 13.2% |
| Consumer Discretionary | XLY | 6.6% |
| Communication Services | XLC | -2.2% |
| Communication Services | XLC | -2.2% |
| Materials | XLB | -6.9% |
| Industrials | XLI | -14.1% |
| Technology | XLK | -21.8% |
| Energy | XLE | -29% |
SCHD vs Asset Classes (12m)
| ASSET CLASS | ETF | DIFFERENCE 12M |
|---|---|---|
| S&P 500 | SPY | -3.23% |
| Gold | GLD | -29.6% |
| Long-Term Bonds | TLT | 26.5% |