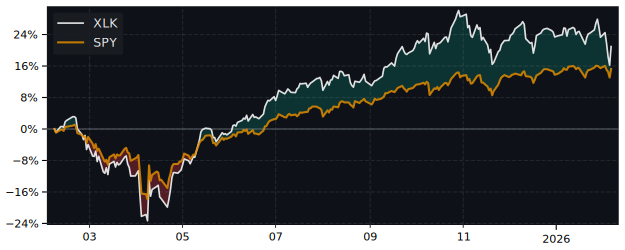
XLK Performance: 40.2% Return (12 Months)
XLK returned 40.2% over 12 months, outperforming the S&P 500 (25.4%). Volatility: 22.7%.
| P/E Trailing | - |
| P/E Forward | - |
| 52 Week High | 151.65 USD |
| 52 Week Low | 89.35 USD |
| VRO Trend Strength ±100 | 63.02 |
| Buy Signal ±3 | 0.09 |
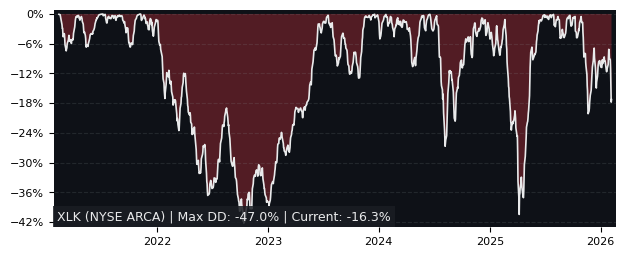
| Max Drawdown | 25.66% |
| Mean Drawdown | 4.10% |
Top Performer in Technology (5/40)
| SYMBOL | 1W | 1M | 3M |
|---|---|---|---|
| PSI | 11.67% | 17.14% | 22.55% |
| AIS | 11.31% | 9.91% | 19.41% |
| FTXL | 11.65% | 15.21% | 17.83% |
| SOXX | 11.49% | 12.63% | 15.23% |
| SOXQ | 10.97% | 11.35% | 13.90% |
| XLK | 4.47% | 1.78% | -2.67% |
| SYMBOL | 6M | 12M | 5Y |
|---|---|---|---|
| AIS | 28.68% | 137.13% | 92.25% |
| PSI | 47.93% | 134.29% | 163.71% |
| FTXL | 44.89% | 131.37% | 159.83% |
| SOXX | 30.75% | 107.52% | 167.61% |
| SOXQ | 27.33% | 106.53% | 183.08% |
| XLK | -1.82% | 40.18% | 109.22% |
| SYMBOL | MCAP | 1M | 12M | 5Y | P/E | P/E fwd | PEG | EPS stab | EPS cagr |
|---|---|---|---|---|---|---|---|---|---|
| AIS NYSE ARCA VistaShares Artificial |
227M | 9.91% | 137% | 92.3% | - | - | - | - | - |
| PSI NYSE ARCA Dynamic Semiconductors |
1.32B | 17.1% | 134% | 164% | - | - | - | - | - |
| SMH NASDAQ Semiconductor |
46.4B | 9.11% | 105% | 250% | - | - | - | - | - |
| SOXQ NASDAQ PHLX Semiconductor |
1.06B | 11.4% | 107% | 183% | - | - | - | - | - |
| SOXX NASDAQ Semiconductor |
21.4B | 12.6% | 108% | 168% | - | - | - | - | - |
| FTXL NASDAQ Nasdaq Semiconductor |
1.56B | 15.2% | 131% | 160% | - | - | - | - | - |
| CHAT NYSE ARCA Roundhill Generative AI |
1.05B | 7.26% | 103% | 172% | - | - | - | - | - |
| BAI NYSE ARCA BlackRock Trust |
9.88B | 10.1% | 72.7% | 51.8% | - | - | - | - | - |
| QTUM NASDAQ Defiance Quantum |
3.36B | 4.17% | 62.4% | 151% | - | - | - | - | - |
| ARTY NYSE ARCA Future AI & Tech |
2.13B | 3.84% | 62.2% | 21.7% | - | - | - | - | - |
Performance: XLK vs S&P 500
| PERIOD | XLK | S&P 500 |
|---|---|---|
| 1 Week | 4.47% | 3.67% |
| 1 Month | 1.78% | 0.52% |
| 3 Months | -2.67% | -1.77% |
| 6 Months | -1.82% | 1.88% |
| 12 Months | 40.18% | 25.35% |
| 5 Years | 109.22% | 76.85% |
XLK Performance FAQ
Does XLK outperform the market?
Yes, XLK significantly outperforms the market. Over the past 12 months, XLK returned 40.18% compared to 25.35% for the S&P 500.
What is the XLK return over the last 12 months?
XLK has returned 40.18% over the past 12 months, including dividends. Over 3 months the return was -2.67%, and over 5 years 109.22%.
How risky is XLK?
XLK has relatively low risk with a maximum drawdown of 25.66% over the past 3 years. The average drawdown is 4.10%.
XLK vs Sectors (12m)
Sorted by outperformance. Positive = XLK beats sector.
| SECTOR | ETF | DIFFERENCE 12M |
|---|---|---|
| Consumer Staples | XLP | 32.1% |
| Health Care | XLV | 30.6% |
| Financials | XLF | 29.8% |
| Real Estate | XLRE | 27.4% |
| Consumer Discretionary | XLY | 24% |
| Communication Services | XLC | 16.8% |
| Communication Services | XLC | 16.8% |
| Materials | XLB | 9.7% |
| Industrials | XLI | 2.5% |
| Technology | XLK | 0% |
| Energy | XLE | -3.5% |
XLK vs Asset Classes (12m)
| ASSET CLASS | ETF | DIFFERENCE 12M |
|---|---|---|
| S&P 500 | SPY | 14.8% |
| Emerging Market | EEM | -9.7% |
| Gold | GLD | -13.3% |
| Long-Term Bonds | TLT | 38.2% |
| Risk-Free Cash | SHY | 36.6% |