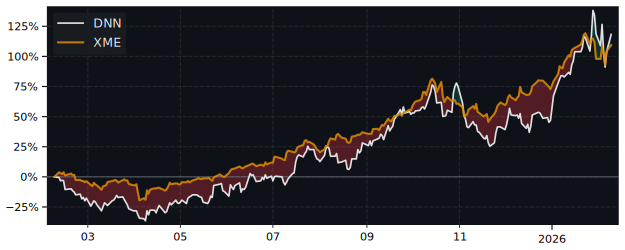
DNN Performance: 210.2% Return (12 Months)
DNN returned 210.2% over 12 months, outperforming the S&P 500 (31.5%). Volatility: 64.5%.
| P/E Trailing | 0.00 |
| P/E Forward | 189 |
| 52 Week High | 4.37 USD |
| 52 Week Low | 1.15 USD |
| VRO Trend Strength ±100 | 26.99 |
| Buy Signal ±3 | -0.58 |
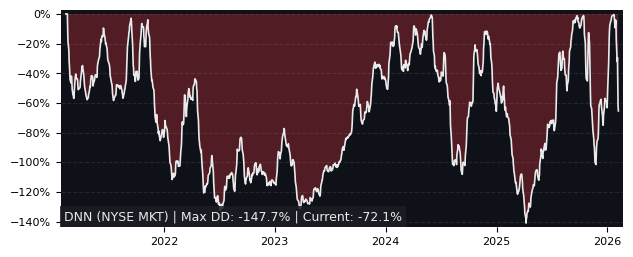
| Max Drawdown | 52.48% |
| Mean Drawdown | 14.24% |
Top Performer in Coal & Consumable Fuels (5/13)
| SYMBOL | 1W | 1M | 3M |
|---|---|---|---|
| TBN | -1.60% | 41.06% | 63.78% |
| ARLP | 0.07% | 4.76% | 23.88% |
| DNN | 10.91% | -5.67% | 13.66% |
| CCJ | 9.46% | -1.46% | 12.38% |
| BTU | -5.94% | 0.84% | 9.85% |
| URG | 10.14% | 4.11% | -5.59% |
| SYMBOL | 6M | 12M | 5Y |
|---|---|---|---|
| UUUU | 4.97% | 414.49% | 159.12% |
| UEC | 3.98% | 230.98% | 282.25% |
| BTU | 7.80% | 230.08% | 943.95% |
| DNN | 30.25% | 210.17% | 181.54% |
| CCJ | 32.21% | 203.52% | 521.74% |
| NXE | 29.76% | 186.10% | 177.30% |
Performance: DNN vs S&P 500
| PERIOD | DNN | S&P 500 | DIFFERENCE |
|---|---|---|---|
| 1 Month | -5.67% | -3.48% | -2.27% |
| 3 Months | 13.66% | -4.38% | 18.87% |
| 6 Months | 30.25% | -1.79% | 32.63% |
| 12 Months | 210.17% | 31.52% | 135.83% |
| 5 Years | 181.54% | 72.80% | 62.92% |
DNN Performance FAQ
Does DNN outperform the market?
Yes, DNN significantly outperforms the market. Over the past 12 months, DNN returned 210.17% compared to 31.52% for the S&P 500.
What is the DNN return over the last 12 months?
DNN has returned 210.17% over the past 12 months, including dividends. Over 3 months the return was 13.66%, and over 5 years 181.54%.
How risky is DNN?
DNN has relatively low risk with a maximum drawdown of 52.48% over the past 3 years. The average drawdown is 14.24%.
DNN vs Sectors (12m)
Sorted by outperformance. Positive = DNN beats sector.
| SECTOR | ETF | DIFFERENCE 12M |
|---|---|---|
| Consumer Staples | XLP | 201.7% |
| Health Care | XLV | 199.1% |
| Real Estate | XLRE | 196.9% |
| Financials | XLF | 196.1% |
| Consumer Discretionary | XLY | 189.5% |
| Communication Services | XLC | 180.7% |
| Communication Services | XLC | 180.7% |
| Materials | XLB | 176% |
| Industrials | XLI | 168.8% |
| Technology | XLK | 161.1% |
| Energy | XLE | 153.9% |
DNN vs Asset Classes (12m)
| ASSET CLASS | ETF | DIFFERENCE 12M |
|---|---|---|
| S&P 500 | SPY | 135.83% |
| Gold | GLD | 153.3% |
| Long-Term Bonds | TLT | 209.4% |