CS Performance: 7.4% Return (12 Months)
CS returned 7.4% over 12 months, underperforming the S&P 500 (23.6%). Volatility: 17.7%.
RS (IBD)
4.59
Top 64% in Peers
Volatility
17.7%
Top 16% in Peers
Total Return 12m
7.42%
Top 64% in Peers
RS Rating
35.73
Top 64% in Peers
| P/E | Value |
|---|---|
| P/E Trailing | 11.1 |
| P/E Forward | 9.11 |
| High / Low | EUR |
|---|---|
| 52 Week High | 43.40 EUR |
| 52 Week Low | 33.40 EUR |
| Sentiment | Value |
|---|---|
| VRO Trend Strength +-100 | 61.90 |
| Buy Signal +-3 | 0.06 |
| Drawdowns | in 3y |
|---|---|
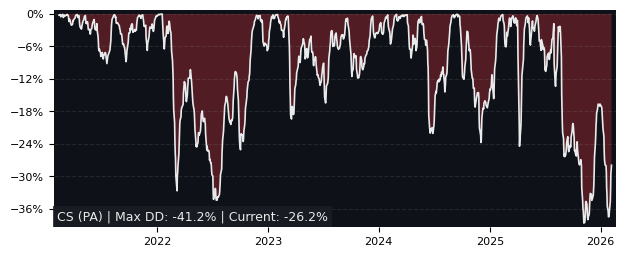
| Max Drawdown | 13.69% |
| Mean Drawdown | 4.22% |
Peer Group: Multi-line Insurance (15 symbols)
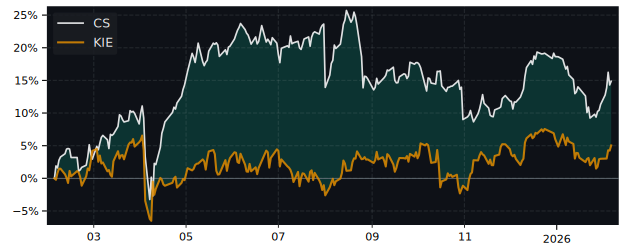
12m Total Return: CS (7.4%) vs SPY (23.6%)
5y Drawdown (Underwater) Chart
Top Performer in Multi-line Insurance (5/15)
Short Term Performance
| Symbol | 1w | 1m | 3m |
|---|---|---|---|
| CS | 6.75% | 3.98% | -0.76% |
| UNI | 7.03% | 7.03% | -1.06% |
| G | 6.83% | 6.61% | -0.89% |
| TLX | 6.50% | 6.92% | -3.18% |
| ASRNL | 5.03% | 3.29% | -1.52% |
| AGN | 5.32% | 4.22% | -5.65% |
Long Term Performance
| Symbol | 6m | 12m | 5y |
|---|---|---|---|
| CS | 0.32% | 7.42% | 135.17% |
| UNI | 12.23% | 48.83% | 504.03% |
| MAP | -1.82% | 39.42% | 184.20% |
| ASRNL | 6.54% | 22.80% | 115.40% |
| G | 9.64% | 14.93% | 192.19% |
| L | 6.03% | 18.50% | 107.91% |
Overall best picks of Peer Group (GARP Metrics)
| Symbol | Market Cap | 1m | 12m | 5y | P/E | P/E Forward | PEG | EPS Stability | EPS CAGR |
|---|---|---|---|---|---|---|---|---|---|
| HIG NYSE Hartford Financial |
37.6B | -3.47% | 12.2% | 121% | 10.1 | 9.84 | 0.12 | 3.40% | -46.2% |
| CS PA AXA |
90.4B | 3.98% | 7.42% | 135% | 11.1 | 9.11 | 1.21 | -5.30% | - |
Performance: CS vs S&P 500
| Total Return | CS | S&P 500 | Difference |
|---|---|---|---|
| 1 Month | 3.98% | -3.34% | 7.57% |
| 3 Months | -0.76% | -4.38% | 3.78% |
| 6 Months | 0.32% | -1.44% | 1.79% |
| 12 Months | 7.42% | 23.60% | -13.1% |
| 5 Years | 135.17% | 72.80% | 36.0% |
FAQs
Does CS outperform the market?
No, CS underperforms the market.
Over the past 12 months, CS returned 7.42% compared to 23.60% for the S&P 500.
What is the CS return over the last 12 months?
CS has returned 7.42% over the past 12 months, including dividends.
Over 3 months the return was -0.76%, and over 5 years 135.17%.
How risky is CS?
CS has relatively low risk with a maximum drawdown of 13.69% over the past 3 years.
The average drawdown is 4.22%.
CS vs Sectors (12m)
Sorted by outperformance. Positive = CS beats sector.
| Sector | ETF | Difference |
|---|---|---|
| Consumer Staples | XLP | 4.82% |
| Health Care | XLV | 3.02% |
| Financials | XLF | 1.96% |
| Real Estate | XLRE | 1.94% |
| Consumer Discretionary | XLY | -6.70% |
| Consumer Discretionary | XLY | -6.70% |
| Communication Services | XLC | -14.8% |
| Materials | XLB | -16.3% |
| Industrials | XLI | -24.5% |
| Technology | XLK | -32.7% |
| Energy | XLE | -33.6% |
CS vs Asset Classes (12m)
| Asset Class | ETF | Difference |
|---|---|---|
| S&P 500 | SPY | -13.1% |
| Gold | GLD | -42.5% |
| Long-Term Bonds | TLT | 8.64% |