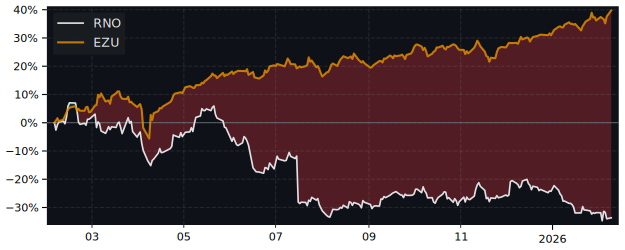
RNO Performance: -25.6% Return (12 Months)
RNO returned -25.6% over 12 months, underperforming the S&P 500 (32.1%). Volatility: 30.2%.
| P/E Trailing | 0.00 |
| P/E Forward | 9.35 |
| 52 Week High | 49.54 EUR |
| 52 Week Low | 27.32 EUR |
| VRO Trend Strength ±100 | 76.35 |
| Buy Signal ±3 | -0.15 |
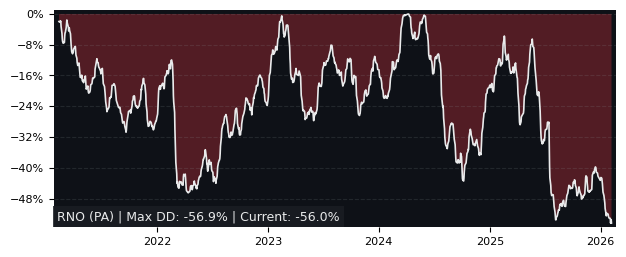
| Max Drawdown | 46.93% |
| Mean Drawdown | 17.33% |
Top Performer in Automobile Manufacturers (5/22)
| SYMBOL | 1W | 1M | 3M |
|---|---|---|---|
| NIO | 13.25% | 30.54% | 30.54% |
| LI | 5.19% | 7.58% | 8.65% |
| PSNY | 16.17% | 19.75% | -4.57% |
| RACE | 1.93% | -2.02% | -7.13% |
| RNO | 5.65% | 5.58% | -13.95% |
| P911 | 4.02% | 4.49% | -14.96% |
| SYMBOL | 6M | 12M | 5Y |
|---|---|---|---|
| NIO | -17.79% | 85.71% | -83.88% |
| GM | 26.74% | 70.40% | 26.95% |
| RIVN | 13.26% | 36.40% | -80.40% |
| F | -6.52% | 32.10% | 23.67% |
| TM | 2.63% | 29.47% | 51.18% |
| RNO | -14.49% | -25.63% | -9.20% |
| SYMBOL | MCAP | 1M | 12M | 5Y | P/E | P/E fwd | PEG | EPS stab | EPS cagr |
|---|---|---|---|---|---|---|---|---|---|
| TM NYSE Toyota Motor |
270B | -6.72% | 29.5% | 51.2% | 11.6 | 11.1 | 1.56 | 51.2% | 21.3% |
| BMW XETRA Bayerische Motoren Werke |
55.4B | -0.70% | 24.6% | 22.7% | 6.66 | 7.46 | 0.62 | -56.8% | -35.7% |
| MBG XETRA Mercedes-Benz |
53.4B | -3.78% | 16.8% | 15.9% | 9.81 | 8.10 | 3.26 | -76.8% | -48.6% |
| VOW3 XETRA Volkswagen VZO O.N. |
51.1B | -2.98% | 8.86% | -43.3% | 6.66 | 4.03 | 0.73 | -51.0% | -17.7% |
| TSLA NASDAQ Tesla |
1,353B | -11.1% | 51.2% | 54.8% | 334 | 182 | 5.20 | -82.1% | -49.4% |
Performance: RNO vs S&P 500
| PERIOD | RNO | S&P 500 | DIFFERENCE |
|---|---|---|---|
| 1 Month | 5.58% | -1.73% | 7.95% |
| 3 Months | -13.95% | -4.49% | -9.48% |
| 6 Months | -14.49% | -1.33% | -12.93% |
| 12 Months | -25.63% | 32.14% | -43.46% |
| 5 Years | -9.20% | 72.70% | -47.18% |
RNO Performance FAQ
Does RNO outperform the market?
No, RNO underperforms the market. Over the past 12 months, RNO returned -25.63% compared to 32.14% for the S&P 500.
What is the RNO return over the last 12 months?
RNO has returned -25.63% over the past 12 months, including dividends. Over 3 months the return was -13.95%, and over 5 years -9.20%.
How risky is RNO?
RNO has relatively low risk with a maximum drawdown of 46.93% over the past 3 years. The average drawdown is 17.33%.
RNO vs Sectors (12m)
Sorted by outperformance. Positive = RNO beats sector.
| SECTOR | ETF | DIFFERENCE 12M |
|---|---|---|
| Consumer Staples | XLP | -35.2% |
| Health Care | XLV | -36.4% |
| Real Estate | XLRE | -39.3% |
| Financials | XLF | -40.5% |
| Consumer Discretionary | XLY | -47.3% |
| Consumer Discretionary | XLY | -47.3% |
| Communication Services | XLC | -55.2% |
| Materials | XLB | -59.3% |
| Industrials | XLI | -67.7% |
| Technology | XLK | -75.6% |
| Energy | XLE | -83.1% |
RNO vs Asset Classes (12m)
| ASSET CLASS | ETF | DIFFERENCE 12M |
|---|---|---|
| S&P 500 | SPY | -43.46% |
| Gold | GLD | -81.9% |
| Long-Term Bonds | TLT | -26.2% |