ZZ-B Performance & Benchmarks - 229.6% in 12m
The Total Return for 3m is 42.1%, for 6m 117.2% and YTD 184.5%. Compare with Peer-Group: Packaged Foods & Meats
Performance Rating
80.29%
#6 in Peer-Group
Rel. Strength
98.19%
#140 in Stock-Universe
Total Return 12m
229.61%
#3 in Peer-Group
Total Return 5y
883.88%
#1 in Peer-Group
| P/E | Value |
|---|---|
| P/E Trailing | 49.5 |
| P/E Forward | - |
| High / Low | SEK |
|---|---|
| 52 Week High | 288.00 SEK |
| 52 Week Low | 71.07 SEK |
| Sentiment | Value |
|---|---|
| VRO Trend Strength +-100 | 22.51 |
| Buy/Sell Signal +-5 | 1.77 |
| Support / Resistance | Levels |
|---|---|
| Support | |
| Resistance |
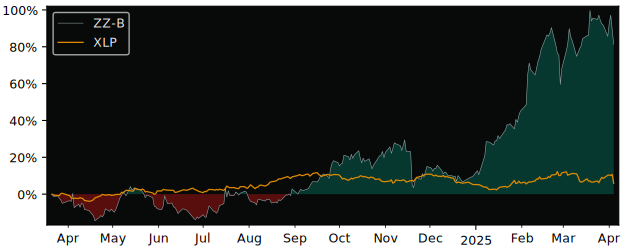
12m Total Return: ZZ-B (229.6%) vs VT (16.1%)
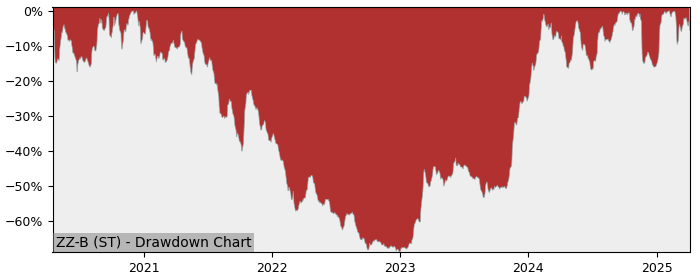
5y Drawdown (Underwater) Chart
Top Performer in Packaged Foods & Meats
Short Term Performance
| Symbol | 1w | 1m | 3m |
|---|---|---|---|
| ZZ-B | 3.86% | -0.21% | 42.1% |
| BTOG | -34.8% | 117% | 95.6% |
| KLG | -0.26% | 35.4% | 31.2% |
| OTLY | -0.33% | 24.8% | 34.2% |
Long Term Performance
| Symbol | 6m | 12m | 5y |
|---|---|---|---|
| ZZ-B | 117% | 230% | 884% |
| ZVIA | -19.4% | 228% | -77.7% |
| BOF | -5.13% | 171% | -63.0% |
| SNX | 54.8% | 175% | 344% |
Overall best picks of Peer Group - Selected by proven GARP Predictive Metrics, sorted by Growth Rating
| Symbol | 1m | 12m | 5y | P/E | P/E Forward | PEG | EPS Stability | EPS CAGR |
|---|---|---|---|---|---|---|---|---|
| CALM NASDAQ Cal-Maine Foods |
5.89% | 60.7% | 198% | 4.21 | - | 0.75 | 25.7% | 40% |
| PPC NASDAQ Pilgrims Pride |
5.36% | 28.2% | 258% | 9.38 | 8.55 | 0.49 | 30.6% | -6.15% |
| POST NYSE Post Holdings |
-5.37% | -4.42% | 79.9% | 19.1 | 28.7 | 1.19 | -28.5% | -29% |
| AGRO NYSE Adecoagro |
-4.24% | -2.78% | 129% | 14.7 | 14.2 | 0.06 | 6.20% | 10.1% |
| KLG NYSE WK Kellogg |
35.4% | 37.7% | 45.4% | 35.5 | 12.5 | 0.39 | -40.8% | -31.4% |
| MFI TO Maple Leaf Foods |
2.26% | 17.4% | 14.7% | 39.8 | 17.5 | 1.59 | 72.3% | 141% |
| SMPL NASDAQ Simply Good Foods |
-7.34% | -11.7% | 25.5% | 23 | 17 | 1.76 | 56.1% | 3.95% |
| PBH TO Premium Brands Holdings |
6.18% | -1.33% | 6.58% | 34.4 | 17.6 | 1.26 | -25.5% | -12.5% |
Performance Comparison: ZZ-B vs VT vs S&P 500
VT (Vanguard Total World Stock ETF) is the Sector Benchmark for ZZ-B
| Total Return (including Dividends) | ZZ-B | VT | S&P 500 |
|---|---|---|---|
| 1 Month | -0.21% | -0.09% | 0.66% |
| 3 Months | 42.07% | 10.26% | 11.66% |
| 12 Months | 229.61% | 16.05% | 15.92% |
| 5 Years | 883.88% | 78.44% | 103.09% |
| Trend Stabilty (consistency of price movement) | ZZ-B | VT | S&P 500 |
|---|---|---|---|
| 1 Month | -69.2% | 52.9% | 66.4% |
| 3 Months | 87.3% | 96% | 96.6% |
| 12 Months | 96% | 64% | 50% |
| 5 Years | 52.8% | 72.5% | 84% |
| Relative Strength (compared with Indexes) | Rank in Peer Group | vs. VT | vs. S&P 500 |
|---|---|---|---|
| 1 Month | 62 %th | -0.11% | -0.86% |
| 3 Month | 96 %th | 31.10% | 29.13% |
| 12 Month | 99 %th | 184.03% | 184.34% |
| 5 Years | 100 %th | 451.39% | 384.46% |
FAQs
Does Zinzino Series (ZZ-B) outperform the market?
Yes,
over the last 12 months ZZ-B made 229.61%, while its related Sector, the Vanguard Total World Stock (VT) made 16.05%.
Over the last 3 months ZZ-B made 42.07%, while VT made 10.26%.
Performance Comparison ZZ-B vs Indeces and Sectors
Above 0 means better perfomance compared to Symbol in this Timeframe
ZZ-B vs. Indices
| Symbol | 1w | 1m | 6m | 12m | |
|---|---|---|---|---|---|
| US S&P 500 | SPY | 6.3% | -0.9% | 112.6% | 214% |
| US NASDAQ 100 | QQQ | 6.1% | -1.5% | 110.1% | 208% |
| German DAX 40 | DAX | 7.1% | 0.9% | 108.3% | 201% |
| Shanghai Shenzhen CSI 300 | CSI 300 | 6.4% | -2.9% | 108.3% | 208% |
| Hongkong Hang Seng | HSI | 6.1% | -2.3% | 89.9% | 191% |
| India NIFTY 50 | INDA | 5.9% | 5.4% | 113.7% | 236% |
| Brasil Bovespa | EWZ | 4.9% | 7.2% | 110.3% | 226% |
ZZ-B vs. Sectors
| Symbol | 1w | 1m | 6m | 12m | |
|---|---|---|---|---|---|
| Communication Services | XLC | 5.3% | 1.3% | 113.2% | 205% |
| Consumer Discretionary | XLY | 7.8% | 0.8% | 122.5% | 210% |
| Consumer Staples | XLP | 5.5% | 2% | 114.9% | 225% |
| Energy | XLE | 5.6% | -0.4% | 118.6% | 232% |
| Financial | XLF | 7.7% | 2.2% | 116.3% | 209% |
| Health Care | XLV | 7.8% | 3.9% | 127.5% | 241% |
| Industrial | XLI | 7.3% | -1.4% | 107.3% | 209% |
| Materials | XLB | 10% | 3.5% | 118.7% | 233% |
| Real Estate | XLRE | 7.4% | 0.8% | 115.8% | 228% |
| Technology | XLK | 5.7% | -2.6% | 104% | 207% |
| Utilities | XLU | 2.4% | -4.9% | 106.1% | 210% |
| Aerospace & Defense | XAR | 6.7% | -4.3% | 94.5% | 184% |
| Biotech | XBI | 5.8% | -3.6% | 123.2% | 242% |
| Homebuilder | XHB | 6.4% | -1.4% | 118.5% | 238% |
| Retail | XRT | 8.7% | 1.7% | 118% | 227% |
ZZ-B vs. Commodities
| Symbol | 1w | 1m | 6m | 12m | |
|---|---|---|---|---|---|
| Oil | USO | 0.4% | -4.98% | 118% | 228% |
| Natural Gas | UNG | 5.4% | 9.7% | 140% | 226% |
| Gold | GLD | 3.3% | -0.7% | 98.3% | 193% |
| Silver | SLV | 7% | -2.8% | 100.1% | 201% |
| Copper | CPER | 26.9% | 12.5% | 115.7% | 222% |
ZZ-B vs. Bonds
| Symbol | 1w | 1m | 6m | 12m | |
|---|---|---|---|---|---|
| iShares 20+ Years Bond | TLT | 2.3% | 0.2% | 115.8% | 234% |
| iShares High Yield Corp. Bond | HYG | 4.5% | 0% | 113.9% | 221% |