TLO Performance & Benchmarks - 142.3% in 12m
The Total Return for 3m is 186.4%, for 6m 250% and YTD 250%. Compare with Peer-Group: Diversified Metals & Mining
Performance Rating
-8.78%
#104 in Peer-Group
Rel. Strength
96.18%
#294 in Stock-Universe
Total Return 12m
142.31%
#27 in Peer-Group
Total Return 5y
16.67%
#91 in Peer-Group
| P/E | Value |
|---|---|
| P/E Trailing | - |
| P/E Forward | 10.0 |
| High / Low | CAD |
|---|---|
| 52 Week High | 0.33 CAD |
| 52 Week Low | 0.08 CAD |
| Sentiment | Value |
|---|---|
| VRO Trend Strength +-100 | 87.03 |
| Buy/Sell Signal +-5 | 2.16 |
| Support / Resistance | Levels |
|---|---|
| Support | |
| Resistance |
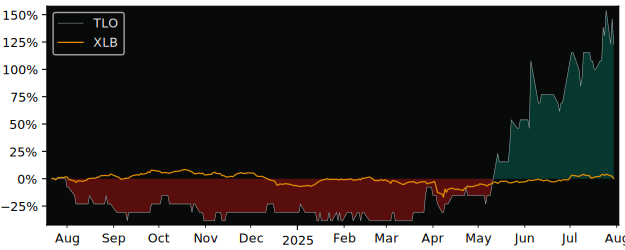
12m Total Return: TLO (142.3%) vs XLB (1.1%)
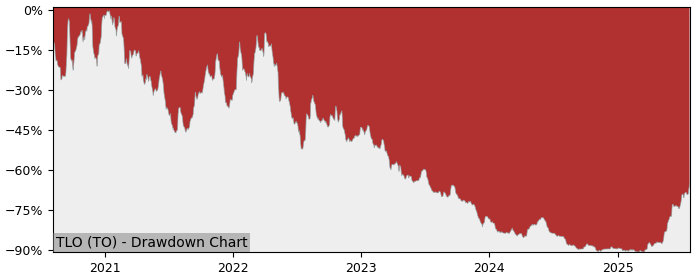
5y Drawdown (Underwater) Chart
Top Performer in Diversified Metals & Mining
Short Term Performance
| Symbol | 1w | 1m | 3m |
|---|---|---|---|
| TLO | 16.7% | 21.2% | 186% |
| SAU | 77.4% | 112% | 686% |
| MP | 0.30% | 81.1% | 145% |
| TI | -5.0% | 92.8% | 102% |
Long Term Performance
| Symbol | 6m | 12m | 5y |
|---|---|---|---|
| TLO | 250% | 142% | 16.7% |
| SAU | 588% | 686% | 588% |
| MLP | 335% | 691% | 352% |
| UAMY | 86.1% | 748% | 667% |
Overall best picks of Peer Group - Selected by proven GARP Predictive Metrics, sorted by Growth Rating
| Symbol | 1m | 12m | 5y | P/E | P/E Forward | PEG | EPS Stability | EPS CAGR |
|---|---|---|---|---|---|---|---|---|
| GEO TO Geodrill |
7.95% | 58.3% | 110% | 9.81 | 8.85 | 0.12 | -37.0% | - |
| KNF NYSE Knife River |
0.17% | 1.43% | 108% | 25.3 | 20.3 | 1.39 | -6.30% | -55.8% |
| BOL ST Boliden |
0.64% | -6.84% | 58.3% | 10.8 | 12 | 1.36 | 0.70% | -11.5% |
Performance Comparison: TLO vs XLB vs S&P 500
XLB (Materials Sector SPDR Fund ETF) is the Sector Benchmark for TLO
| Total Return (including Dividends) | TLO | XLB | S&P 500 |
|---|---|---|---|
| 1 Month | 21.15% | 3.27% | 2.82% |
| 3 Months | 186.36% | 9.20% | 14.94% |
| 12 Months | 142.31% | 1.07% | 18.07% |
| 5 Years | 16.67% | 65.91% | 108.95% |
| Trend Stabilty (consistency of price movement) | TLO | XLB | S&P 500 |
|---|---|---|---|
| 1 Month | 50.1% | 21.4% | 91.8% |
| 3 Months | 93.5% | 91.7% | 97.6% |
| 12 Months | 49.6% | -43.7% | 49.5% |
| 5 Years | -77.2% | 75.8% | 84% |
| Relative Strength (compared with Indexes) | Rank in Peer Group | vs. XLB | vs. S&P 500 |
|---|---|---|---|
| 1 Month | 82 %th | 17.32% | 17.83% |
| 3 Month | 100 %th | 162.23% | 149.14% |
| 12 Month | 88 %th | 139.75% | 105.23% |
| 5 Years | 56 %th | -29.68% | -44.17% |
FAQs
Does Talon Metals (TLO) outperform the market?
Yes,
over the last 12 months TLO made 142.31%, while its related Sector, the Materials Sector SPDR Fund (XLB) made 1.07%.
Over the last 3 months TLO made 186.36%, while XLB made 9.20%.
Performance Comparison TLO vs Indeces and Sectors
Above 0 means better perfomance compared to Symbol in this Timeframe
TLO vs. Indices
| Symbol | 1w | 1m | 6m | 12m | |
|---|---|---|---|---|---|
| US S&P 500 | SPY | 15.7% | 18.3% | 243.8% | 124% |
| US NASDAQ 100 | QQQ | 15.6% | 18.3% | 240.8% | 119% |
| German DAX 40 | DAX | 16% | 20% | 238.6% | 111% |
| Shanghai Shenzhen CSI 300 | CSI 300 | 16.7% | 15.3% | 239% | 116% |
| Hongkong Hang Seng | HSI | 14.7% | 14.5% | 218.3% | 99% |
| India NIFTY 50 | INDA | 18.7% | 25.1% | 244.1% | 148% |
| Brasil Bovespa | EWZ | 17.6% | 28.4% | 239.5% | 140% |
TLO vs. Sectors
| Symbol | 1w | 1m | 6m | 12m | |
|---|---|---|---|---|---|
| Communication Services | XLC | 18.3% | 23.4% | 245.3% | 115% |
| Consumer Discretionary | XLY | 17.1% | 17.8% | 252.3% | 120% |
| Consumer Staples | XLP | 17.2% | 20.9% | 245.9% | 136% |
| Energy | XLE | 12.6% | 16.3% | 249.3% | 142% |
| Financial | XLF | 16.4% | 20.3% | 246.3% | 119% |
| Health Care | XLV | 16% | 21.4% | 256.9% | 151% |
| Industrial | XLI | 15.5% | 17.6% | 238.5% | 119% |
| Materials | XLB | 18% | 17.9% | 246.6% | 141% |
| Real Estate | XLRE | 16.6% | 17.9% | 244% | 135% |
| Technology | XLK | 14.6% | 16.9% | 235.7% | 119% |
| Utilities | XLU | 17.2% | 17.6% | 238.2% | 121% |
| Aerospace & Defense | XAR | 15.6% | 17.8% | 223.5% | 94% |
| Biotech | XBI | 17.7% | 17.6% | 257.3% | 157% |
| Homebuilder | XHB | 17.9% | 14.2% | 252.6% | 152% |
| Retail | XRT | 19.6% | 17% | 249.8% | 137% |
TLO vs. Commodities
| Symbol | 1w | 1m | 6m | 12m | |
|---|---|---|---|---|---|
| Oil | USO | 10.8% | 12.0% | 247% | 136% |
| Natural Gas | UNG | 20.5% | 30.1% | 267% | 140% |
| Gold | GLD | 19.8% | 20.7% | 229.5% | 103% |
| Silver | SLV | 19.6% | 15.5% | 226.2% | 106% |
| Copper | CPER | 18.1% | 10.5% | 219.9% | 106% |
TLO vs. Bonds
| Symbol | 1w | 1m | 6m | 12m | |
|---|---|---|---|---|---|
| iShares 20+ Years Bond | TLT | 15.8% | 21.8% | 248.6% | 145% |
| iShares High Yield Corp. Bond | HYG | 16.7% | 20.9% | 246.1% | 133% |