DGNX Performance & Benchmarks - 832.9% in 12m
The Total Return for 3m is -41.2%, for 6m 5.8% and YTD 832.9%. Compare with Peer-Group: Application Software
Performance Rating
24.99%
#44 in Peer-Group
Rel. Strength
99.86%
#12 in Stock-Universe
Total Return 12m
832.86%
#2 in Peer-Group
Total Return 5y
832.86%
#3 in Peer-Group
| P/E | Value |
|---|---|
| P/E Trailing | - |
| P/E Forward | - |
| High / Low | USD |
|---|---|
| 52 Week High | 138.01 USD |
| 52 Week Low | 5.69 USD |
| Sentiment | Value |
|---|---|
| VRO Trend Strength +-100 | 33.77 |
| Buy/Sell Signal +-5 | -1.63 |
| Support / Resistance | Levels |
|---|---|
| Support | |
| Resistance |
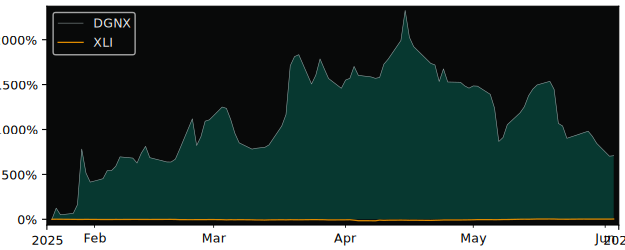
12m Total Return: DGNX (832.9%) vs XLI (22.9%)
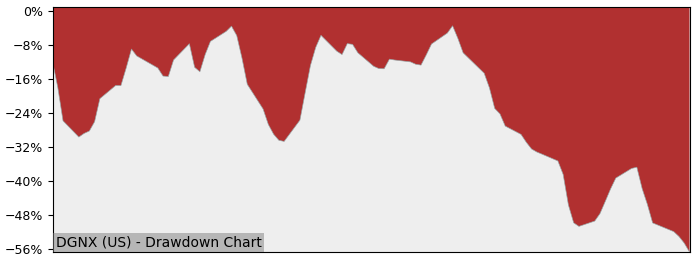
5y Drawdown (Underwater) Chart
Top Performer in Application Software
Short Term Performance
| Symbol | 1w | 1m | 3m |
|---|---|---|---|
| DGNX | -5.33% | 3.19% | -41.2% |
| NVNI | 69.2% | 118% | 203% |
| HUBC | -6.76% | 108% | 67.4% |
| MIM | -8.08% | 83.8% | 78.4% |
Long Term Performance
| Symbol | 6m | 12m | 5y |
|---|---|---|---|
| DGNX | 5.84% | 833% | 833% |
| ALTBG | 498% | 1,915% | 287% |
| DAVE | 130% | 506% | -29.8% |
| PRCH | 209% | 531% | 24.9% |
Overall best picks of Peer Group - Selected by proven GARP Predictive Metrics, sorted by Growth Rating
| Symbol | 1m | 12m | 5y | P/E | P/E Forward | PEG | EPS Stability | EPS CAGR |
|---|---|---|---|---|---|---|---|---|
| INTU NASDAQ Intuit |
2.51% | 27.5% | 171% | 61.3 | 33.4 | 1.95 | 50.8% | 120% |
| SAP XETRA SAP SE |
-3.76% | 30% | 102% | 44.1 | 41.3 | 1.46 | 86.6% | 36.5% |
| FICO NYSE Fair Isaac |
-17.7% | -5.27% | 243% | 66.1 | 41.8 | 1.18 | 94.0% | 22.2% |
| SAP NYSE SAP SE |
-5.45% | 38.7% | 96.2% | 44 | 41.3 | 1.46 | 59.7% | 45.6% |
| PTC NASDAQ PTC |
18.5% | 15.2% | 139% | 56.2 | 30.4 | 1.79 | 44.0% | 31% |
| SSNC NASDAQ SS&C Technologies Holdings |
2.97% | 17.2% | 57.8% | 26.9 | 14.6 | 1 | 53.1% | 5.68% |
| GEN NASDAQ Gen Digital |
2.96% | 18.3% | 57.2% | 29.4 | 12.1 | 0.88 | -12.5% | -11.3% |
| MGIC NASDAQ Magic Software Enterprises |
8.37% | 94.7% | 107% | 28.2 | 23.9 | 1.08 | -31.1% | - |
Performance Comparison: DGNX vs XLI vs S&P 500
XLI (Industrial Sector SPDR ETF) is the Sector Benchmark for DGNX
| Total Return (including Dividends) | DGNX | XLI | S&P 500 |
|---|---|---|---|
| 1 Month | 3.19% | 3.55% | 2.82% |
| 3 Months | -41.16% | 17.60% | 14.94% |
| 12 Months | 832.86% | 22.91% | 18.07% |
| 5 Years | 832.86% | 129.98% | 108.95% |
| Trend Stabilty (consistency of price movement) | DGNX | XLI | S&P 500 |
|---|---|---|---|
| 1 Month | 33.4% | 93% | 91.8% |
| 3 Months | -46.9% | 93.8% | 97.6% |
| 12 Months | 9.7% | 56.7% | 49.5% |
| 5 Years | 9.7% | 87.2% | 84% |
| Relative Strength (compared with Indexes) | Rank in Peer Group | vs. XLI | vs. S&P 500 |
|---|---|---|---|
| 1 Month | 55 %th | -0.34% | 0.36% |
| 3 Month | 5 %th | -49.97% | -48.81% |
| 12 Month | 100 %th | 751.31% | 785.24% |
| 5 Years | 100 %th | 751.31% | 785.24% |
FAQs
Does Diginex Ordinary (DGNX) outperform the market?
Yes,
over the last 12 months DGNX made 832.86%, while its related Sector, the Industrial Sector SPDR (XLI) made 22.91%.
Over the last 3 months DGNX made -41.16%, while XLI made 17.60%.
Performance Comparison DGNX vs Indeces and Sectors
Above 0 means better perfomance compared to Symbol in this Timeframe
DGNX vs. Indices
| Symbol | 1w | 1m | 6m | 12m | |
|---|---|---|---|---|---|
| US S&P 500 | SPY | -6.4% | 0.4% | -0.4% | 815% |
| US NASDAQ 100 | QQQ | -6.4% | 0.4% | -3.4% | 810% |
| German DAX 40 | DAX | -6% | 2% | -5.6% | 801% |
| Shanghai Shenzhen CSI 300 | CSI 300 | -5.3% | -2.7% | -5.2% | 807% |
| Hongkong Hang Seng | HSI | -7.4% | -3.5% | -25.9% | 789% |
| India NIFTY 50 | INDA | -3.3% | 7.1% | -0% | 838% |
| Brasil Bovespa | EWZ | -4.4% | 10.4% | -4.7% | 830% |
DGNX vs. Sectors
| Symbol | 1w | 1m | 6m | 12m | |
|---|---|---|---|---|---|
| Communication Services | XLC | -3.7% | 5.4% | 1.1% | 806% |
| Consumer Discretionary | XLY | -5% | -0.2% | 8.1% | 811% |
| Consumer Staples | XLP | -4.8% | 2.9% | 1.8% | 827% |
| Energy | XLE | -9.4% | -1.7% | 5.1% | 832% |
| Financial | XLF | -5.6% | 2.4% | 2.2% | 809% |
| Health Care | XLV | -6% | 3.5% | 12.8% | 842% |
| Industrial | XLI | -6.5% | -0.4% | -5.7% | 810% |
| Materials | XLB | -4% | -0.1% | 2.5% | 832% |
| Real Estate | XLRE | -5.4% | -0% | -0.1% | 825% |
| Technology | XLK | -7.4% | -1.1% | -8.5% | 809% |
| Utilities | XLU | -4.8% | -0.4% | -5.9% | 811% |
| Aerospace & Defense | XAR | -6.4% | -0.2% | -20.7% | 785% |
| Biotech | XBI | -4.3% | -0.3% | 13.1% | 847% |
| Homebuilder | XHB | -4.1% | -3.8% | 8.4% | 842% |
| Retail | XRT | -2.4% | -0.9% | 5.7% | 827% |
DGNX vs. Commodities
| Symbol | 1w | 1m | 6m | 12m | |
|---|---|---|---|---|---|
| Oil | USO | -11.2% | -5.96% | 3.24% | 827% |
| Natural Gas | UNG | -1.5% | 12.2% | 22.8% | 831% |
| Gold | GLD | -2.2% | 2.7% | -14.6% | 794% |
| Silver | SLV | -2.4% | -2.5% | -18% | 797% |
| Copper | CPER | -3.9% | -7.4% | -24.3% | 796% |
DGNX vs. Bonds
| Symbol | 1w | 1m | 6m | 12m | |
|---|---|---|---|---|---|
| iShares 20+ Years Bond | TLT | -6.3% | 3.9% | 4.5% | 835% |
| iShares High Yield Corp. Bond | HYG | -5.3% | 2.9% | 1.9% | 824% |