KSC Performance & Benchmarks - -12.9% in 12m
The Total Return for 3m is 7%, for 6m -3.9% and YTD -6.6%. Compare with Peer-Group: Data Processing & Outsourced Services
Performance Rating
-83.86%
#51 in Peer-Group
Rel. Strength
30.31%
#5344 in Stock-Universe
Total Return 12m
-12.88%
#36 in Peer-Group
Total Return 5y
-84.27%
#48 in Peer-Group
| P/E | Value |
|---|---|
| P/E Trailing | - |
| P/E Forward | - |
| High / Low | EUR |
|---|---|
| 52 Week High | 0.95 EUR |
| 52 Week Low | 0.70 EUR |
| Sentiment | Value |
|---|---|
| VRO Trend Strength +-100 | 30.54 |
| Buy/Sell Signal +-5 | 1.52 |
| Support / Resistance | Levels |
|---|---|
| Support | |
| Resistance |
12m Total Return: KSC (-12.9%) vs XLK (27%)
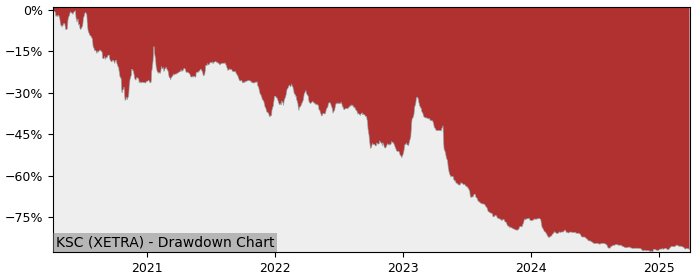
5y Drawdown (Underwater) Chart
Top Performer in Data Processing & Outsourced Services
Short Term Performance
| Symbol | 1w | 1m | 3m |
|---|---|---|---|
| KSC | - | -5.23% | 6.97% |
| ALBDM | -28.8% | -51.4% | 372% |
| GDS | -3.95% | 15.4% | 47.9% |
| TIXT | -4.69% | 6.34% | 54.4% |
Long Term Performance
| Symbol | 6m | 12m | 5y |
|---|---|---|---|
| KSC | -3.86% | -12.9% | -84.3% |
| ALBDM | 447% | 156% | 167% |
| KC | 3.01% | 426% | -65.2% |
| GDS | 53.0% | 233% | -56.7% |
Overall best picks of Peer Group - Selected by proven GARP Predictive Metrics, sorted by Growth Rating
| Symbol | 1m | 12m | 5y | P/E | P/E Forward | PEG | EPS Stability | EPS CAGR |
|---|---|---|---|---|---|---|---|---|
| EXLS NASDAQ ExlService Holdings |
-2.28% | 21.4% | 229% | 32 | 22.8 | 1.52 | 81.2% | 24% |
| BR NYSE Broadridge Financial |
1.5% | 16.3% | 95.7% | 38 | 27 | 1.8 | 23.2% | -0.64% |
| CSGS NASDAQ CSG Systems International |
-4.46% | 36.3% | 62.5% | 21.2 | 13.2 | 1.32 | 61.1% | 49.7% |
| FOUR NYSE Shift4 Payments |
5% | 51% | 163% | 36.5 | 19.6 | 0.56 | 25.7% | - |
| III NASDAQ Information |
-10.2% | 27% | 140% | 28.3 | 16.7 | 0.93 | -82.4% | -33.1% |
| GFT XETRA GFT Technologies SE |
-20% | -22.2% | 83.5% | 13.7 | 9.59 | 1.04 | -34.4% | -13.7% |
| G NYSE Genpact |
0.43% | 28.5% | 16.2% | 15.4 | 18.3 | 1.7 | 58.9% | 24.9% |
| WNS NYSE WNS Holdings |
18.4% | 26.7% | 19.1% | 20.9 | 16.3 | 1.63 | 6.30% | -10.1% |
Performance Comparison: KSC vs XLK vs S&P 500
XLK (Technology Sector SPDR ETF) is the Sector Benchmark for KSC
| Total Return (including Dividends) | KSC | XLK | S&P 500 |
|---|---|---|---|
| 1 Month | -5.23% | 4.52% | 2.69% |
| 3 Months | 6.97% | 26.79% | 14.80% |
| 12 Months | -12.88% | 26.96% | 18.52% |
| 5 Years | -84.27% | 143.65% | 107.25% |
| Trend Stabilty (consistency of price movement) | KSC | XLK | S&P 500 |
|---|---|---|---|
| 1 Month | -64.4% | 93.9% | 91.2% |
| 3 Months | -22.5% | 97.8% | 97.5% |
| 12 Months | -43% | 40% | 49.7% |
| 5 Years | -97% | 85.9% | 84% |
| Relative Strength (compared with Indexes) | Rank in Peer Group | vs. XLK | vs. S&P 500 |
|---|---|---|---|
| 1 Month | 31 %th | -9.33% | -7.71% |
| 3 Month | 50 %th | -15.63% | -6.82% |
| 12 Month | 38 %th | -28.47% | -25.30% |
| 5 Years | 10 %th | -93.54% | -92.41% |
FAQs
Does Kps (KSC) outperform the market?
No,
over the last 12 months KSC made -12.88%, while its related Sector, the Technology Sector SPDR (XLK) made 26.96%.
Over the last 3 months KSC made 6.97%, while XLK made 26.79%.
Performance Comparison KSC vs Indeces and Sectors
Above 0 means better perfomance compared to Symbol in this Timeframe
KSC vs. Indices
| Symbol | 1w | 1m | 6m | 12m | |
|---|---|---|---|---|---|
| US S&P 500 | SPY | -0% | -7.9% | -9.4% | -31% |
| US NASDAQ 100 | QQQ | -0.8% | -8.2% | -12.7% | -38% |
| German DAX 40 | DAX | -0.2% | -6.7% | -15.1% | -44% |
| Shanghai Shenzhen CSI 300 | CSI 300 | 0.7% | -10.2% | -13.6% | -38% |
| Hongkong Hang Seng | HSI | -0.6% | -10.7% | -31.9% | -56% |
| India NIFTY 50 | INDA | 3.7% | 0.1% | -7.3% | -6% |
| Brasil Bovespa | EWZ | 2.2% | 1.6% | -11.8% | -17% |
KSC vs. Sectors
| Symbol | 1w | 1m | 6m | 12m | |
|---|---|---|---|---|---|
| Communication Services | XLC | 1.8% | -3.3% | -8.8% | -40% |
| Consumer Discretionary | XLY | 1.5% | -7.9% | -0% | -35% |
| Consumer Staples | XLP | 1.5% | -4.6% | -6% | -19% |
| Energy | XLE | -1% | -8.6% | -2.7% | -10% |
| Financial | XLF | 0.8% | -5.9% | -6.4% | -35% |
| Health Care | XLV | 1.5% | -4.8% | 4.3% | -4% |
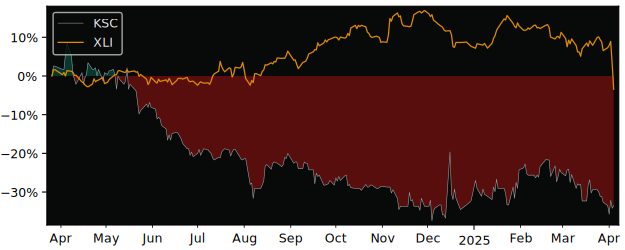
| Industrial | XLI | 1.1% | -8.3% | -13.6% | -35% |
| Materials | XLB | 3.7% | -6.4% | -4.2% | -12% |
| Real Estate | XLRE | 1.6% | -7% | -7% | -18% |
| Technology | XLK | -1.7% | -9.8% | -18.3% | -40% |
| Utilities | XLU | -1% | -9.6% | -14.2% | -35% |
| Aerospace & Defense | XAR | 1.1% | -8.9% | -28.8% | -61% |
| Biotech | XBI | 2.2% | -9.2% | 3.9% | -0% |
| Homebuilder | XHB | 4.4% | -9.6% | 2.9% | -1% |
| Retail | XRT | 4.2% | -8.3% | -1.6% | -17% |
KSC vs. Commodities
| Symbol | 1w | 1m | 6m | 12m | |
|---|---|---|---|---|---|
| Oil | USO | -7.7% | -16.1% | -8.09% | -22% |
| Natural Gas | UNG | 2.6% | 7.4% | 13.4% | -8% |
| Gold | GLD | 3.6% | -4% | -20.5% | -48% |
| Silver | SLV | 6.1% | -7.4% | -20.5% | -43% |
| Copper | CPER | 21.8% | 5.5% | -7.8% | -23% |
KSC vs. Bonds
| Symbol | 1w | 1m | 6m | 12m | |
|---|---|---|---|---|---|
| iShares 20+ Years Bond | TLT | -1% | -4% | -4.3% | -9% |
| iShares High Yield Corp. Bond | HYG | 0.3% | -5.3% | -7.3% | -22% |