(WELJ) Amundi S&P Global - Performance 4.2% in 12m
WELJ performance: live returns, drawdowns, peer ranking & SPY comparison from 1w to 5y, all in one clean chart-driven dashboard.
Performance Rating
46.04%
#21 in Peer-Group
Rel. Strength
47.50%
#4035 in Stock-Universe
Total Return 12m
4.21%
#23 in Peer-Group
Total Return 5y
36.42%
#32 in Peer-Group
| P/E | Value |
|---|---|
| P/E Trailing | - |
| P/E Forward | - |
| High / Low | EUR |
|---|---|
| 52 Week High | 14.77 EUR |
| 52 Week Low | 10.50 EUR |
| Sentiment | Value |
|---|---|
| VRO Trend Strength +-100 | 66.80 |
| Buy/Sell Signal +-5 | -0.83 |
| Support / Resistance | Levels |
|---|---|
| Support | |
| Resistance |
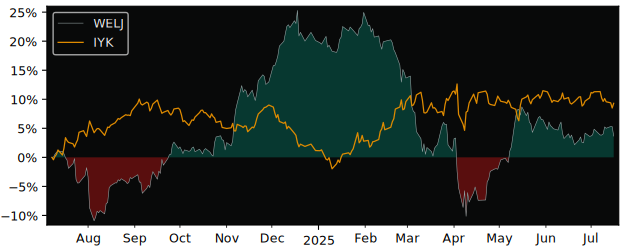
12m Total Return: WELJ (4.2%) vs IYK (8.1%)
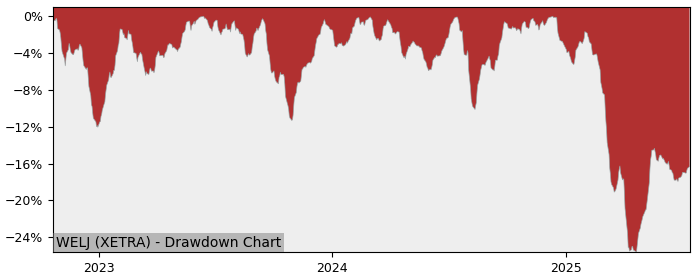
5y Drawdown (Underwater) Chart
Top Performer in Sector Equity Consumer Goods & Services
Overall best picks of Peer Group - Selected by proven GARP Predictive Metrics, sorted by Growth Rating
| Symbol | 1m | 12m | 5y | P/E | P/E Forward | PEG | EPS Stability | EPS CAGR |
|---|---|---|---|---|---|---|---|---|
| 2B7D XETRA iShares SP500 Consumer |
-1.32% | 2.12% | 53% | - | - | - | - | - |
| QDVK XETRA iShares SP500 Consumer |
2.96% | 9.24% | 68.2% | - | - | - | - | - |
| 3SUE XETRA iShares MSCI World Consumer |
-1.79% | -0.5% | 31.2% | - | - | - | - | - |
| EXV9 XETRA iShares (DE) I - iShares |
1.37% | 8.74% | 54.6% | - | - | - | - | - |
| EXV5 XETRA iShares STOXX Europe 600 |
3.53% | -13.4% | 55.2% | - | - | - | - | - |
| ESIS XETRA iShares MSCI Europe |
-2.96% | 2.51% | 15.8% | - | - | - | - | - |
| ESIC XETRA iShares MSCI Europe |
0.73% | -6.56% | 23.8% | - | - | - | - | - |
Performance Comparison: WELJ vs IYK vs S&P 500
IYK (iShares US Consumer Staples ETF) is the Sector Benchmark for WELJ
| Total Return (including Dividends) | WELJ | IYK | S&P 500 |
|---|---|---|---|
| 1 Month | 1.19% | -1.63% | 3.54% |
| 3 Months | 10.96% | -1.45% | 16.07% |
| 12 Months | 4.21% | 8.06% | 12.18% |
| 5 Years | 36.42% | 70.28% | 107.69% |
| Trend Score (consistency of price movement) | WELJ | IYK | S&P 500 |
|---|---|---|---|
| 1 Month | 82.5% | -2.3% | 91.9% |
| 3 Months | 30.7% | 10.6% | 97.5% |
| 12 Months | 30.7% | 57.7% | 47% |
| 5 Years | 91.8% | 90.2% | 84% |
| Relative Strength (compared with Indexes) | Rank in Peer Group | vs. IYK | vs. S&P 500 |
|---|---|---|---|
| 1 Month | %th64.62 | 2.87% | -2.27% |
| 3 Month | %th66.15 | 12.59% | -4.40% |
| 12 Month | %th66.15 | -3.56% | -7.10% |
| 5 Years | %th98.46 | 10.94% | -24.51% |
FAQs
Does Amundi S&P Global (WELJ) outperform the market?
No,
over the last 12 months WELJ made 4.21%, while its related Sector, the iShares US Consumer Staples (IYK) made 8.06%.
Over the last 3 months WELJ made 10.96%, while IYK made -1.45%.
Performance Comparison WELJ vs Indeces and Sectors
Above 0 means better perfomance compared to Symbol in this Timeframe
WELJ vs. Indices
| Symbol | 1w | 1m | 6m | 12m | |
|---|---|---|---|---|---|
| US S&P 500 | SPY | 1.1% | -2.4% | -18% | -8% |
| US NASDAQ 100 | QQQ | 0.6% | -3.1% | -20.5% | -9% |
| German DAX 40 | DAX | 2.1% | -0.3% | -28.8% | -24% |
| Shanghai Shenzhen CSI 300 | CSI 300 | 0.5% | -3.8% | -22.1% | -15% |
| Hongkong Hang Seng | HSI | 0.5% | -1.3% | -40% | -30% |
| India NIFTY 50 | INDA | 2.9% | 0.6% | -19.5% | 8% |
| Brasil Bovespa | EWZ | 5.7% | 4.2% | -30.1% | 4% |
WELJ vs. Sectors
| Symbol | 1w | 1m | 6m | 12m | |
|---|---|---|---|---|---|
| Communication Services | XLC | 2.1% | -0.6% | -22.2% | -20% |
| Consumer Discretionary | XLY | 0.8% | -1.4% | -9.3% | -11% |
| Consumer Staples | XLP | 3% | 1.9% | -18.8% | -2% |
| Energy | XLE | 3.2% | 1.5% | -7.8% | 7% |
| Financial | XLF | 2.5% | -1.4% | -17.6% | -18% |
| Health Care | XLV | 3.2% | 3% | -7.6% | 13% |
| Industrial | XLI | 0.7% | -3.5% | -23.9% | -17% |
| Materials | XLB | 3.7% | -0.5% | -15.9% | 4% |
| Real Estate | XLRE | 1.7% | 1.8% | -16.8% | -2% |
| Technology | XLK | 0.8% | -5.1% | -23.9% | -7% |
| Utilities | XLU | 0.4% | -0.7% | -20.7% | -17% |
| Aerospace & Defense | XAR | -1.7% | -8% | -38.6% | -45% |
| Biotech | XBI | -0% | -1.9% | -9.5% | 18% |
| Homebuilder | XHB | 2.8% | -4.3% | -4.7% | 11% |
| Retail | XRT | 2.3% | -1.7% | -13.9% | -1% |
WELJ vs. Commodities
| Symbol | 1w | 1m | 6m | 12m | |
|---|---|---|---|---|---|
| Oil | USO | 3.6% | 5.43% | -1.69% | 10% |
| Natural Gas | UNG | -3.4% | 9.7% | 6.3% | -3% |
| Gold | GLD | 0.6% | 2.8% | -35.7% | -33% |
| Silver | SLV | -1.5% | -2.5% | -35% | -18% |
| Copper | CPER | -0.2% | -12.4% | -36.8% | -18% |
WELJ vs. Bonds
| Symbol | 1w | 1m | 6m | 12m | |
|---|---|---|---|---|---|
| iShares 20+ Years Bond | TLT | 2.6% | 1.4% | -12.6% | 9% |
| iShares High Yield Corp. Bond | HYG | 1.6% | 0.3% | -16.1% | -4% |