The Berkeley Group Holdings plc (BKG)
Exchange: London Exchange • Country: United Kingdom • Currency: GBX • Type: Common Stock • ISIN: GB00BLJNXL82
The Berkeley Group Holdings plc, a UK-based company founded in 1976, is a leading player in residential and mixed-use property development. The company, along with its subsidiaries, is actively engaged in various ancillary activities within the real estate sector primarily in the United Kingdom.
One of the key activities of The Berkeley Group Holdings plc is land selling, which adds another dimension to its overall business operations. The company operates under several well-known brand names such as Berkeley, St Edward, St George, St James, St Joseph, and St William, each representing different facets of its property development initiatives.
Headquartered in Cobham, United Kingdom, The Berkeley Group Holdings plc has established a strong presence in the real estate industry over the years. For more information, one can visit the company's official website at https://www.berkeleygroup.co.uk.
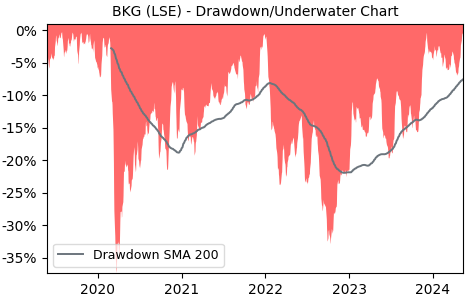
Drawdown (Underwater) Chart

Overall Trend and Yearly Seasonality

BKG Stock Overview
| Market Cap in USD | 60m |
| Sector | Consumer Cyclical |
| Industry | Residential Construction |
| GiC SubIndustry | Homebuilding |
| TER | 0.00% |
| IPO / Inception |
BKG Stock Ratings
| Growth 5y | 3.86 |
| Fundamental | 65.2 |
| Dividend | 6.49 |
| Rel. Performance vs Sector | -3.22 |
| Analysts | - |
| Fair Price Momentum | 4348.17 GBX |
| Fair Price DCF | 108.27 GBX |
BKG Dividends
| Yield 12m | 1.98% |
| Yield on Cost 5y | 2.92% |
| Dividends CAGR 5y | 26.24% |
| Payout Consistency | 60.5% |
BKG Growth Ratios
| Growth 12m | 6.88% |
| Growth Correlation 12m | 49% |
| Growth Correlation 3m | -32% |
| CAGR 5y | 8.02% |
| Sharpe Ratio 12m | 0.08 |
| Alpha vs SP500 12m | -13.76 |
| Beta vs SP500 5y weekly | 0.83 |
| ValueRay RSI | 60.48 |
| Volatility GJR Garch 1y | 24.65% |
| Price / SMA 50 | 0.18% |
| Price / SMA 200 | 5.45% |
| Current Volume | 191.2k |
| Average Volume 20d | 263k |
External Links for BKG Stock
As of April 26, 2024, the stock is trading at GBX 4652.00 with a total of 191,218 shares traded.
Over the past week, the price has changed by +0.69%, over one month by -1.59%, over three months by -2.49% and over the past year by +9.21%.
According to ValueRays Forecast Model, BKG The Berkeley Group Holdings plc will be worth about 4805.2 in April 2025. The stock is currently trading at 4652.00. This means that the stock has a potential upside of +3.29%.
| Issuer | Forecast | Upside |
|---|---|---|
| Wallstreet Target Price | 4825.4 | 3.73 |
| Analysts Target Price | - | - |
| ValueRay Target Price | 4805.2 | 3.29 |