Understanding Relx PLC: History, Operations, and Market Status
The History of Relx PLC
Relx PLC, formerly known as Reed Elsevier, is a company that has evolved significantly since its inception. Founded through the merger of Reed International, a British trade book and magazine publisher, and Elsevier, a Dutch scientific publisher, in 1992, Relx has grown into a leading global provider of information and analytics for professional and business customers across industries.
Core Business Operations
At its core, Relx focuses on four main sectors: Scientific, Technical & Medical, Legal, Risk & Business Analytics, and Exhibitions. The Scientific, Technical & Medical segment is involved in providing information and analytics that help institutions and professionals progress in science and health. The Legal segment offers tools and decision-support solutions. Risk & Business Analytics provides data and analytics that help customers assess, predict, and manage risk. Finally, the Exhibitions segment organizes events and conferences across various industries, fostering connections, and promoting businesses.
Side Businesses and Diversification
While the mentioned sectors form the backbone of Relx's operations, the company has continuously looked to diversify its offerings. This includes acquisitions and development of digital tools and platforms that complement its existing services, thereby enhancing its overall portfolio and providing added value to its customers.
Current Market Status
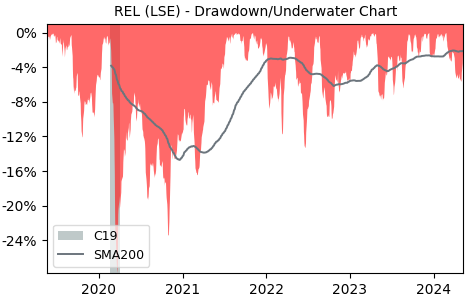
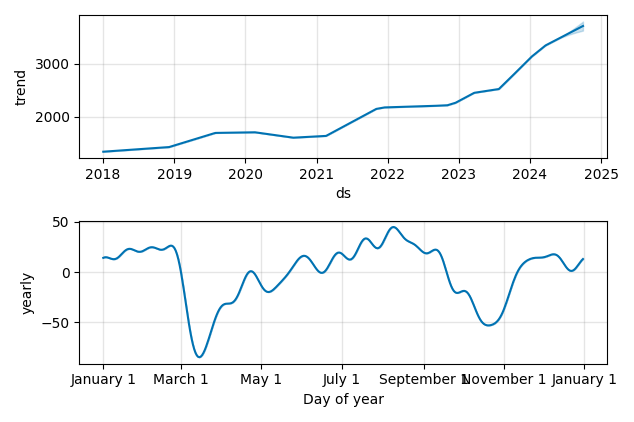
Relx PLC has positioned itself as a leader in the provision of professional information solutions, experiencing steady growth in its core segments. The company is listed on the London Stock Exchange (LSE: REL) and is a constituent of the FTSE 100 Index. With a commitment to innovation and customer service, it continues to explore new areas of growth and development, adapting to the changing needs of the global marketplace.