AMCX Performance: 20.1% Return (12 Months)
AMCX returned 20.1% over 12 months, underperforming the S&P 500 (31.5%). Volatility: 54.7%.
| P/E Trailing | 4.22 |
| P/E Forward | 3.14 |
| 52 Week High | 10.01 USD |
| 52 Week Low | 5.55 USD |
| VRO Trend Strength ±100 | 41.86 |
| Buy Signal ±3 | -0.50 |
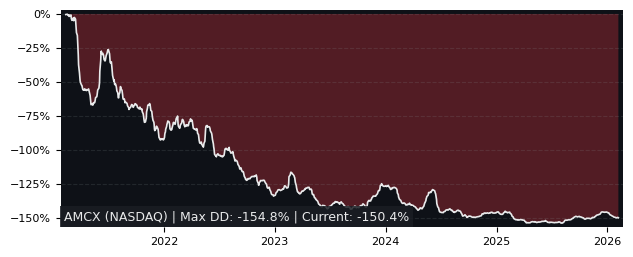
| Max Drawdown | 73.08% |
| Mean Drawdown | 47.56% |
Top Performer in Broadcasting (5/18)
| SYMBOL | 1W | 1M | 3M |
|---|---|---|---|
| TDAY | 4.41% | 10.59% | 33.71% |
| SESG | 2.42% | 2.92% | 12.19% |
| RWAY | 2.55% | 0.50% | 9.22% |
| RRTL | 0.00% | 3.25% | 4.73% |
| MMT | 1.55% | 3.15% | -2.48% |
| AMCX | 7.66% | -13.41% | -24.53% |
| SYMBOL | 6M | 12M | 5Y |
|---|---|---|---|
| IHRT | -1.25% | 162.50% | -82.73% |
| TDAY | 73.17% | 161.03% | 33.46% |
| SSP | 51.45% | 55.32% | -81.52% |
| SESG | 0.09% | 36.74% | 42.89% |
| RRTL | 4.88% | 22.43% | 9.36% |
| AMCX | -9.58% | 20.10% | -86.16% |
| SYMBOL | MCAP | 1M | 12M | 5Y | P/E | P/E fwd | PEG | EPS stab | EPS cagr |
|---|---|---|---|---|---|---|---|---|---|
| RRTL XETRA RTL |
6.60B | 3.25% | 22.4% | 9.36% | 247 | 10.0 | - | -56.9% | -47.5% |
| IHRT NASDAQ iHeartMedia |
450M | -2.48% | 163% | -82.7% | - | 6.27 | 5.03 | 4.30% | 0.24% |
Performance: AMCX vs S&P 500
| PERIOD | AMCX | S&P 500 | DIFFERENCE |
|---|---|---|---|
| 1 Month | -13.41% | -3.48% | -10.29% |
| 3 Months | -24.53% | -4.38% | -21.07% |
| 6 Months | -9.58% | -1.79% | -7.93% |
| 12 Months | 20.10% | 31.52% | -8.68% |
| 5 Years | -86.16% | 72.80% | -91.99% |
AMCX Performance FAQ
Does AMCX outperform the market?
No, AMCX underperforms the market. Over the past 12 months, AMCX returned 20.10% compared to 31.52% for the S&P 500.
What is the AMCX return over the last 12 months?
AMCX has returned 20.10% over the past 12 months, including dividends. Over 3 months the return was -24.53%, and over 5 years -86.16%.
How risky is AMCX?
AMCX has relatively low risk with a maximum drawdown of 73.08% over the past 3 years. The average drawdown is 47.56%.
AMCX vs Sectors (12m)
Sorted by outperformance. Positive = AMCX beats sector.
| SECTOR | ETF | DIFFERENCE 12M |
|---|---|---|
| Consumer Staples | XLP | 11.6% |
| Health Care | XLV | 9% |
| Real Estate | XLRE | 6.9% |
| Financials | XLF | 6% |
| Consumer Discretionary | XLY | -0.6% |
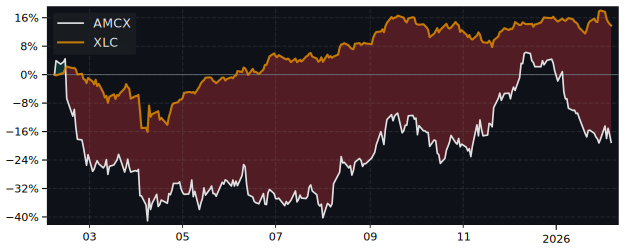
| Communication Services | XLC | -9.4% |
| Communication Services | XLC | -9.4% |
| Materials | XLB | -14% |
| Industrials | XLI | -21.3% |
| Technology | XLK | -29% |
| Energy | XLE | -36.2% |
AMCX vs Asset Classes (12m)
| ASSET CLASS | ETF | DIFFERENCE 12M |
|---|---|---|
| S&P 500 | SPY | -8.68% |
| Gold | GLD | -36.8% |
| Long-Term Bonds | TLT | 19.3% |