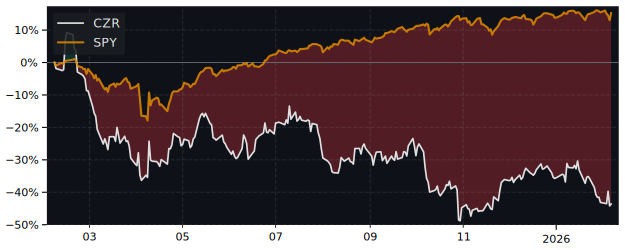
CZR Performance: 11.7% Return (12 Months)
CZR returned 11.7% over 12 months, underperforming the S&P 500 (31.5%). Volatility: 46.7%.
| P/E Trailing | 0.00 |
| P/E Forward | 39.4 |
| 52 Week High | 31.51 USD |
| 52 Week Low | 18.14 USD |
| VRO Trend Strength ±100 | 70.90 |
| Buy Signal ±3 | -0.40 |
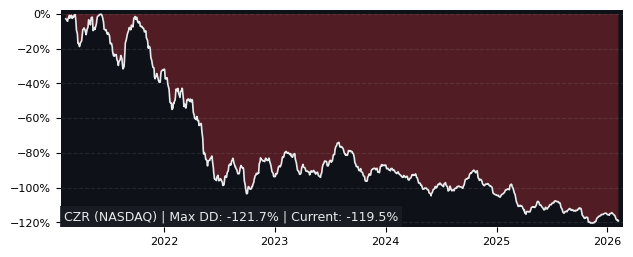
| Max Drawdown | 69.45% |
| Mean Drawdown | 37.52% |
Top Performer in Casinos & Gaming (5/19)
| SYMBOL | 1W | 1M | 3M |
|---|---|---|---|
| RSI | 9.57% | 8.62% | 14.72% |
| CZR | 4.04% | -0.23% | 11.19% |
| LTMC | 3.57% | 3.49% | 10.20% |
| MGM | 2.98% | -1.21% | 2.00% |
| MCRI | 2.60% | -1.98% | 0.68% |
| BYD | 4.45% | 2.34% | -5.04% |
| SYMBOL | 6M | 12M | 5Y |
|---|---|---|---|
| RSI | 21.35% | 115.38% | 34.44% |
| LVS | 4.93% | 72.81% | -8.61% |
| LTMC | 16.23% | 48.43% | 223.08% |
| MGM | 8.14% | 39.47% | -12.00% |
| GDEN | 20.40% | 12.13% | 11.15% |
| CZR | 0.57% | 11.71% | -70.58% |
| SYMBOL | MCAP | 1M | 12M | 5Y | P/E | P/E fwd | PEG | EPS stab | EPS cagr |
|---|---|---|---|---|---|---|---|---|---|
| SGHC NYSE SGHC |
4.91B | -4.73% | 74.9% | 19.5% | 23.1 | 12.9 | - | 37.0% | 174% |
| MCRI NASDAQ Monarch Casino & Resort |
1.73B | -1.98% | 34.4% | 70.3% | 17.8 | 16.8 | 1.07 | -15.4% | -45.1% |
| BYD NYSE Boyd Gaming |
6.32B | 2.34% | 38.0% | 41.6% | 3.71 | 10.9 | 3.03 | -22.9% | -46.2% |
| RRR NASDAQ Red Rock Resorts |
5.66B | -7.54% | 51.1% | 104% | 17.6 | 14.3 | 9.37 | -34.8% | -35.8% |
Performance: CZR vs S&P 500
| PERIOD | CZR | S&P 500 | DIFFERENCE |
|---|---|---|---|
| 1 Month | -0.23% | -3.48% | 3.37% |
| 3 Months | 11.19% | -4.38% | 16.28% |
| 6 Months | 0.57% | -1.79% | 2.41% |
| 12 Months | 11.71% | 31.52% | -15.07% |
| 5 Years | -70.58% | 72.80% | -82.98% |
CZR Performance FAQ
Does CZR outperform the market?
No, CZR underperforms the market. Over the past 12 months, CZR returned 11.71% compared to 31.52% for the S&P 500.
What is the CZR return over the last 12 months?
CZR has returned 11.71% over the past 12 months, including dividends. Over 3 months the return was 11.19%, and over 5 years -70.58%.
How risky is CZR?
CZR has relatively low risk with a maximum drawdown of 69.45% over the past 3 years. The average drawdown is 37.52%.
CZR vs Sectors (12m)
Sorted by outperformance. Positive = CZR beats sector.
| SECTOR | ETF | DIFFERENCE 12M |
|---|---|---|
| Consumer Staples | XLP | 3.2% |
| Health Care | XLV | 0.6% |
| Real Estate | XLRE | -1.5% |
| Financials | XLF | -2.4% |
| Consumer Discretionary | XLY | -9% |
| Communication Services | XLC | -17.8% |
| Communication Services | XLC | -17.8% |
| Materials | XLB | -22.4% |
| Industrials | XLI | -29.7% |
| Technology | XLK | -37.4% |
| Energy | XLE | -44.6% |
CZR vs Asset Classes (12m)
| ASSET CLASS | ETF | DIFFERENCE 12M |
|---|---|---|
| S&P 500 | SPY | -15.07% |
| Gold | GLD | -45.2% |
| Long-Term Bonds | TLT | 11% |