HA - Hawaiian Holdings - Stock Price & Dividends
Exchange: USA Stocks • Country: United States • Currency: USD • Type: Common Stock • ISIN: US4198791018
Airline Services, Passenger Transport, Cargo Transport
Hawaiian Holdings, Inc. is a leading air transportation company that operates through its subsidiary, Hawaiian Airlines, Inc. The company provides scheduled passenger and cargo services, connecting the Hawaiian Islands with major destinations in North America, Asia, and the Pacific.
In North America, Hawaiian Airlines offers daily flights between the State of Hawai'i and key cities in California, Nevada, Washington, Oregon, Arizona, New York, Texas, and Massachusetts. This extensive network provides convenient access to the Hawaiian Islands for tourists and business travelers alike.
Within the State of Hawai'i, the company operates daily services on its Neighbor Island routes, linking the four major islands of O'ahu, Maui, Kaua'i, and Hawai'i. This comprehensive network enables residents and visitors to easily travel between the islands, promoting economic growth and tourism.
Hawaiian Airlines also operates an extensive international network, offering scheduled services to Tokyo, Osaka, and Seoul in Asia, as well as Sydney, Auckland, and Pago Pago in the Pacific. Additionally, the company operates ad hoc charters to various destinations, catering to diverse customer needs.
The company distributes its tickets through multiple channels, including its user-friendly website, travel agencies, and wholesale distributors. This multi-channel approach ensures that customers can easily book their flights and access the company's services.
As of December 2023, Hawaiian Airlines operates a modern fleet of 61 aircraft, comprising Boeing 717-200, Airbus A330-200, and Airbus A321neo planes. This diverse fleet enables the company to efficiently serve its various routes, providing a comfortable and reliable travel experience for its customers.
With a rich history dating back to 1929, Hawaiian Holdings, Inc. is headquartered in Honolulu, Hawaii, and is committed to providing exceptional air transportation services that showcase the spirit of Aloha.
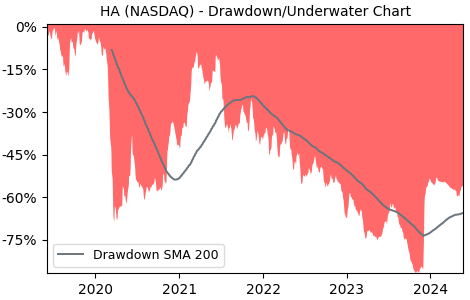
Drawdown (Underwater) Chart
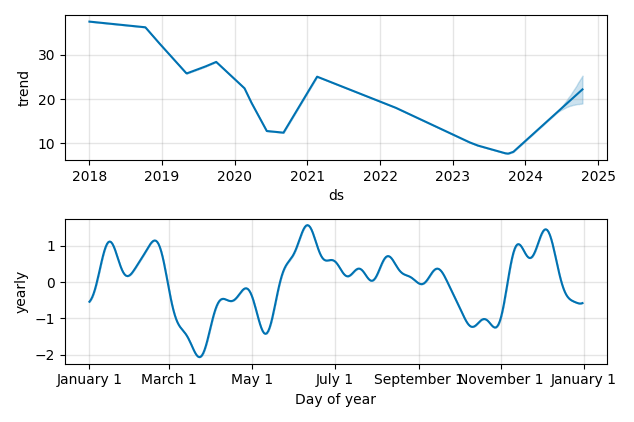
Overall Trend and Yearly Seasonality
HA Stock Overview
| Market Cap in USD | 702m |
| Sector | Industrials |
| Industry | Airlines |
| GiC SubIndustry | Passenger Airlines |
| TER | 0.00% |
| IPO / Inception | 1995-07-26 |
HA Stock Ratings
| Growth 5y | -38.9 |
| Fundamental | -69.3 |
| Dividend | 0.00 |
| Rel. Performance vs Sector | -2.66 |
| Analysts | 3.40/5 |
| Fair Price Momentum | 10.93 USD |
| Fair Price DCF | - |
HA Dividends
| Dividend Yield 12m | 0.00% |
| Yield on Cost 5y | 0.00% |
| Dividends CAGR 5y | -100.00% |
| Payout Consistency | 28.9% |
HA Growth Ratios
| Growth 12m | 12.27% |
| Growth Correlation 12m | 18% |
| Growth Correlation 3m | 0% |
| CAGR 5y | -13.74% |
| CAGR/Mean DD 5y | -0.30 |
| Sharpe Ratio 12m | 0.03 |
| Alpha vs SP500 12m | -22.03 |
| Beta vs SP500 5y weekly | 1.87 |
| ValueRay RSI | 31.39 |
| Volatility GJR Garch 1y | 99.77% |
| Price / SMA 50 | -5.47% |
| Price / SMA 200 | 5.6% |
| Current Volume | 1175.9k |
| Average Volume 20d | 1151.1k |
External Links for HA Stock
Wall Street Journal • Benzinga • Yahoo Finance
Tweets
X • Stocktwits
Fund Manager Positions
Dataroma • Stockcircle
As of July 27, 2024, the stock is trading at USD 12.44 with a total of 1,175,871 shares traded.
Over the past week, the price has changed by -10.50%, over one month by +1.14%, over three months by +1.39% and over the past year by +7.33%.
According to ValueRays Forecast Model, HA Hawaiian Holdings will be worth about 11.8 in July 2025. The stock is currently trading at 12.44. This means that the stock has a potential downside of -5.14%.
| Issuer | Forecast | Upside |
|---|---|---|
| Wallstreet Target Price | 11.3 | -9.57 |
| Analysts Target Price | 6.5 | -47.7 |
| ValueRay Target Price | 11.8 | -5.14 |