ICHR Performance: 178.7% Return (12 Months)
ICHR returned 178.7% over 12 months, outperforming the S&P 500 (32.2%). Volatility: 100.7%.
| P/E Trailing | 0.00 |
| P/E Forward | 38.5 |
| 52 Week High | 53.58 USD |
| 52 Week Low | 14.06 USD |
| VRO Trend Strength ±100 | 71.18 |
| Buy Signal ±3 | 0.63 |
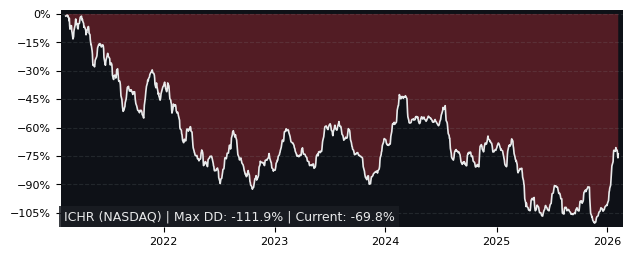
| Max Drawdown | 69.09% |
| Mean Drawdown | 30.50% |
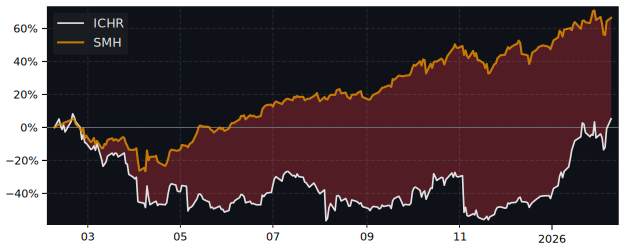
Top Performer in Semiconductor Materials & Equipment (5/37)
| SYMBOL | 1W | 1M | 3M |
|---|---|---|---|
| AEHR | 35.52% | 22.92% | 107.82% |
| ICHR | 4.81% | 17.06% | 106.90% |
| UCTT | 1.95% | 19.83% | 89.56% |
| SOI | -5.11% | 17.31% | 87.02% |
| FORM | 8.38% | 18.06% | 67.60% |
| AIXA | 3.82% | 18.71% | 63.61% |
| SYMBOL | 6M | 12M | 5Y |
|---|---|---|---|
| AEHR | 92.16% | 595.98% | 2002.51% |
| MU | 103.51% | 453.58% | 306.24% |
| TER | 128.95% | 341.43% | 145.70% |
| FORM | 170.72% | 331.35% | 106.73% |
| AIXA | 133.49% | 261.55% | 88.28% |
| ICHR | 160.81% | 178.67% | -18.19% |
| SYMBOL | MCAP | 1M | 12M | 5Y | P/E | P/E fwd | PEG | EPS stab | EPS cagr |
|---|---|---|---|---|---|---|---|---|---|
| AMAT NASDAQ Applied Materials |
277B | 4.53% | 169% | 166% | 35.7 | 32.6 | 1.69 | 87.5% | 6.95% |
| CAMT NASDAQ Camtek |
7.34B | 2.56% | 189% | 394% | 152 | 46.5 | 3.11 | 94.7% | 17.7% |
| LRCX NASDAQ Lam Research |
274B | 6.25% | 263% | 257% | 44.9 | 32.7 | 1.60 | -3.10% | -47.4% |
| MU NASDAQ Micron Technology |
413B | -2.97% | 454% | 306% | 17.3 | 6.33 | 0.21 | 62.1% | 51.2% |
| TER NASDAQ Teradyne |
48.5B | 8.11% | 341% | 146% | 89.2 | 51.8 | 1.72 | -5.20% | 17.6% |
Performance: ICHR vs S&P 500
| PERIOD | ICHR | S&P 500 | DIFFERENCE |
|---|---|---|---|
| 1 Month | 17.06% | -2.54% | 20.12% |
| 3 Months | 106.90% | -4.14% | 115.84% |
| 6 Months | 160.81% | -0.92% | 163.23% |
| 12 Months | 178.67% | 32.20% | 110.79% |
| 5 Years | -18.19% | 71.53% | -52.30% |
ICHR Performance FAQ
Does ICHR outperform the market?
Yes, ICHR significantly outperforms the market. Over the past 12 months, ICHR returned 178.67% compared to 32.20% for the S&P 500.
What is the ICHR return over the last 12 months?
ICHR has returned 178.67% over the past 12 months, including dividends. Over 3 months the return was 106.90%, and over 5 years -18.19%.
How risky is ICHR?
ICHR has relatively low risk with a maximum drawdown of 69.09% over the past 3 years. The average drawdown is 30.50%.
ICHR vs Sectors (12m)
Sorted by outperformance. Positive = ICHR beats sector.
| SECTOR | ETF | DIFFERENCE 12M |
|---|---|---|
| Consumer Staples | XLP | 171% |
| Health Care | XLV | 167.7% |
| Real Estate | XLRE | 165.1% |
| Financials | XLF | 163.8% |
| Consumer Discretionary | XLY | 158.4% |
| Communication Services | XLC | 149.1% |
| Communication Services | XLC | 149.1% |
| Materials | XLB | 145.4% |
| Industrials | XLI | 136.8% |
| Technology | XLK | 128% |
| Energy | XLE | 120% |
ICHR vs Asset Classes (12m)
| ASSET CLASS | ETF | DIFFERENCE 12M |
|---|---|---|
| S&P 500 | SPY | 110.79% |
| Gold | GLD | 120.9% |
| Long-Term Bonds | TLT | 178.1% |