CNMD Performance: -38.1% Return (12 Months)
CNMD returned -38.1% over 12 months, underperforming the S&P 500 (32.1%). Volatility: 41.3%.
| P/E Trailing | 23.0 |
| P/E Forward | 27.2 |
| 52 Week High | 60.28 USD |
| 52 Week Low | 33.49 USD |
| VRO Trend Strength ±100 | 21.62 |
| Buy Signal ±3 | -0.75 |
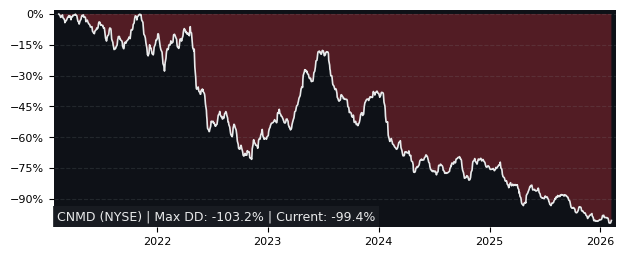
| Max Drawdown | 74.82% |
| Mean Drawdown | 44.36% |
Top Performer in Health Care Equipment (5/87)
| SYMBOL | 1W | 1M | 3M |
|---|---|---|---|
| PLSE | 16.86% | 26.46% | 56.37% |
| VMD | 4.39% | 11.16% | 34.62% |
| TALK | 0.39% | 9.24% | 32.65% |
| MASS | 19.13% | 9.42% | 26.85% |
| CCLD | -7.95% | 18.25% | 10.96% |
| CNMD | 1.76% | -14.59% | -21.64% |
| SYMBOL | 6M | 12M | 5Y |
|---|---|---|---|
| BWAY | 65.20% | 192.22% | 170.25% |
| BFLY | 61.33% | 99.52% | -75.18% |
| AXGN | 90.21% | 96.39% | 62.71% |
| TALK | 83.75% | 96.23% | -47.74% |
| TCMD | 61.96% | 84.32% | -54.90% |
| CNMD | -26.66% | -38.06% | -73.83% |
| SYMBOL | MCAP | 1M | 12M | 5Y | P/E | P/E fwd | PEG | EPS stab | EPS cagr |
|---|---|---|---|---|---|---|---|---|---|
| BWAY NASDAQ Brainsway |
544M | 1.94% | 192% | 170% | 75.4 | 64.5 | - | 83.9% | 20.2% |
| LMAT NASDAQ LeMaitre Vascular |
2.47B | 1.88% | 38.8% | 127% | 43.1 | 37.6 | 3.13 | 45.5% | -34.6% |
| GMED NYSE Globus Medical |
11.9B | 1.72% | 25.2% | 33.7% | 22.4 | 19.7 | 1.49 | 91.5% | 34.6% |
| BVS NASDAQ Bioventus |
604M | 7.25% | 9.07% | -35.5% | 27.2 | 11.9 | 1.19 | 47.0% | 61.3% |
| IDXX NASDAQ IDEXX Laboratories |
45.3B | -5.09% | 52.4% | 15.6% | 43.5 | 39.5 | 3.96 | 77.9% | 8.48% |
| TCMD NASDAQ Tactile Systems Technology |
560M | -14.7% | 84.3% | -54.9% | 30.0 | 19.1 | 17.2 | 49.8% | 172% |
| PEN NYSE Penumbra |
13.0B | -2.59% | 25.2% | 21.3% | 72.9 | 63.7 | 0.74 | 60.5% | -3.72% |
| SNN NYSE Smith & Nephew SNATS |
13.7B | -3.45% | 30.2% | -2.73% | 22.5 | 12.5 | 0.66 | 0.90% | -69.0% |
| TMDX NASDAQ TransMedics |
3.44B | -19.1% | 51.6% | 228% | 20.6 | 39.8 | - | 63.5% | 21.0% |
| AVR NASDAQ Anteris Technologies Global |
535M | -16.8% | 77.9% | -14.0% | - | - | - | 32.6% | 331% |
Performance: CNMD vs S&P 500
| PERIOD | CNMD | S&P 500 | DIFFERENCE |
|---|---|---|---|
| 1 Month | -14.59% | -1.73% | -13.08% |
| 3 Months | -21.64% | -4.49% | -17.95% |
| 6 Months | -26.66% | -1.33% | -25.67% |
| 12 Months | -38.06% | 32.14% | -53.12% |
| 5 Years | -73.83% | 72.70% | -84.85% |
CNMD Performance FAQ
Does CNMD outperform the market?
No, CNMD underperforms the market. Over the past 12 months, CNMD returned -38.06% compared to 32.14% for the S&P 500.
What is the CNMD return over the last 12 months?
CNMD has returned -38.06% over the past 12 months, including dividends. Over 3 months the return was -21.64%, and over 5 years -73.83%.
How risky is CNMD?
CNMD has relatively low risk with a maximum drawdown of 74.82% over the past 3 years. The average drawdown is 44.36%.
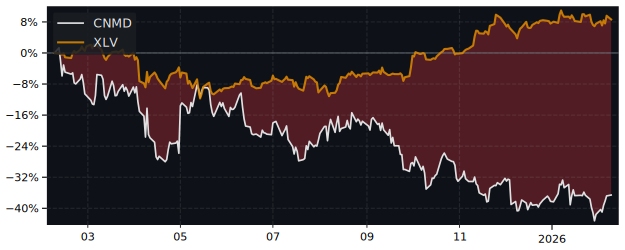
CNMD vs Sectors (12m)
Sorted by outperformance. Positive = CNMD beats sector.
| SECTOR | ETF | DIFFERENCE 12M |
|---|---|---|
| Consumer Staples | XLP | -47.6% |
| Health Care | XLV | -48.8% |
| Real Estate | XLRE | -51.7% |
| Financials | XLF | -52.9% |
| Consumer Discretionary | XLY | -59.8% |
| Consumer Discretionary | XLY | -59.8% |
| Communication Services | XLC | -67.6% |
| Materials | XLB | -71.7% |
| Industrials | XLI | -80.2% |
| Technology | XLK | -88% |
| Energy | XLE | -95.5% |
CNMD vs Asset Classes (12m)
| ASSET CLASS | ETF | DIFFERENCE 12M |
|---|---|---|
| S&P 500 | SPY | -53.12% |
| Gold | GLD | -94.3% |
| Long-Term Bonds | TLT | -38.7% |