DLB Performance: -10.7% Return (12 Months)
DLB returned -10.7% over 12 months, underperforming the S&P 500 (32.1%). Volatility: 22.1%.
| P/E Trailing | 25.0 |
| P/E Forward | 14.3 |
| 52 Week High | 79.63 USD |
| 52 Week Low | 58.03 USD |
| VRO Trend Strength ±100 | 61.17 |
| Buy Signal ±3 | -0.48 |
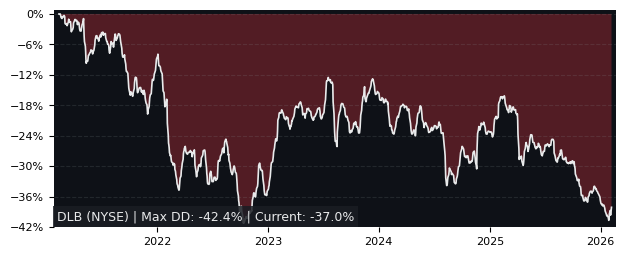
| Max Drawdown | 32.93% |
| Mean Drawdown | 12.92% |
Top Performer in Electronic Components (5/11)
| SYMBOL | 1W | 1M | 3M |
|---|---|---|---|
| GLW | 13.96% | 18.83% | 64.45% |
| LFUS | 5.78% | 12.08% | 21.88% |
| VSH | 13.29% | 13.05% | 13.94% |
| BELFB | 4.58% | 7.83% | 12.49% |
| KN | 6.14% | 5.07% | 10.93% |
| DLB | 5.27% | -6.03% | -4.60% |
| SYMBOL | 6M | 12M | 5Y |
|---|---|---|---|
| GLW | 72.57% | 275.43% | 275.53% |
| BELFB | 46.74% | 224.96% | 1037.94% |
| LFUS | 30.75% | 114.18% | 32.55% |
| APH | 2.90% | 109.17% | 289.14% |
| KN | 6.88% | 99.16% | 23.07% |
| DLB | -14.66% | -10.69% | -35.47% |
Performance: DLB vs S&P 500
| PERIOD | DLB | S&P 500 | DIFFERENCE |
|---|---|---|---|
| 1 Month | -6.03% | -1.73% | -4.38% |
| 3 Months | -4.60% | -4.49% | -0.12% |
| 6 Months | -14.66% | -1.33% | -13.51% |
| 12 Months | -10.69% | 32.14% | -32.42% |
| 5 Years | -35.47% | 72.70% | -62.64% |
DLB Performance FAQ
Does DLB outperform the market?
No, DLB underperforms the market. Over the past 12 months, DLB returned -10.69% compared to 32.14% for the S&P 500.
What is the DLB return over the last 12 months?
DLB has returned -10.69% over the past 12 months, including dividends. Over 3 months the return was -4.60%, and over 5 years -35.47%.
How risky is DLB?
DLB has relatively low risk with a maximum drawdown of 32.93% over the past 3 years. The average drawdown is 12.92%.
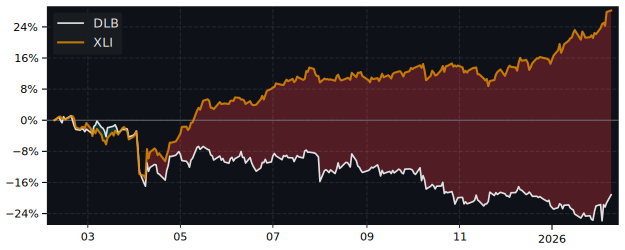
DLB vs Sectors (12m)
Sorted by outperformance. Positive = DLB beats sector.
| SECTOR | ETF | DIFFERENCE 12M |
|---|---|---|
| Consumer Staples | XLP | -20.2% |
| Health Care | XLV | -21.4% |
| Real Estate | XLRE | -24.4% |
| Financials | XLF | -25.6% |
| Consumer Discretionary | XLY | -32.4% |
| Consumer Discretionary | XLY | -32.4% |
| Communication Services | XLC | -40.2% |
| Materials | XLB | -44.3% |
| Industrials | XLI | -52.8% |
| Technology | XLK | -60.7% |
| Energy | XLE | -68.1% |
DLB vs Asset Classes (12m)
| ASSET CLASS | ETF | DIFFERENCE 12M |
|---|---|---|
| S&P 500 | SPY | -32.42% |
| Gold | GLD | -66.9% |
| Long-Term Bonds | TLT | -11.3% |