GRMN Performance: 36.5% Return (12 Months)
GRMN returned 36.5% over 12 months, in line with the S&P 500 (32.1%). Volatility: 35.6%.
| P/E Trailing | 27.7 |
| P/E Forward | 25.3 |
| 52 Week High | 257.67 USD |
| 52 Week Low | 170.82 USD |
| VRO Trend Strength ±100 | 45.89 |
| Buy Signal ±3 | 0.49 |
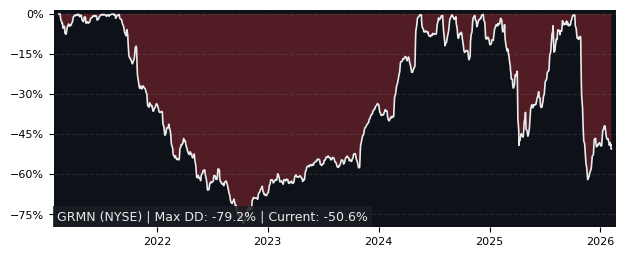
| Max Drawdown | 27.97% |
| Mean Drawdown | 6.28% |
Top Performer in Household Durables (5/37)
| SYMBOL | 1W | 1M | 3M |
|---|---|---|---|
| GRMN | 7.43% | 0.10% | 16.42% |
| HOV | 5.19% | 0.03% | 12.50% |
| GRBK | 5.59% | -3.00% | 2.89% |
| LEGH | 1.09% | 2.52% | 2.01% |
| LOVE | 6.48% | 25.63% | -2.80% |
| ETD | -0.95% | -1.57% | -4.59% |
| SYMBOL | 6M | 12M | 5Y |
|---|---|---|---|
| IBP | 12.74% | 64.48% | 149.96% |
| SN | 14.98% | 54.44% | 162.49% |
| TOL | -1.71% | 47.05% | 147.96% |
| HOME | -2.30% | 38.68% | 130.47% |
| LEG | 12.58% | 37.48% | -74.30% |
| GRMN | -5.00% | 36.45% | 99.37% |
| SYMBOL | MCAP | 1M | 12M | 5Y | P/E | P/E fwd | PEG | EPS stab | EPS cagr |
|---|---|---|---|---|---|---|---|---|---|
| IBP NYSE Installed Building Products |
7.37B | -11.9% | 64.5% | 150% | 28.2 | 25.1 | 1.20 | 60.4% | 21.9% |
| TOL NYSE Toll Brothers |
12.9B | -6.68% | 47.1% | 148% | 9.74 | 10.9 | 0.99 | 25.4% | 4.60% |
| SN NYSE SharkNinja |
14.7B | -2.36% | 54.4% | 162% | 21.1 | 17.5 | 1.75 | 84.3% | 177% |
| GRMN NYSE Garmin |
45.7B | 0.10% | 36.5% | 99.4% | 27.7 | 25.3 | 3.08 | 8.0% | -46.6% |
| DLG MI De Longhi S.p.A. |
5.39B | -12.3% | 33.0% | -0.33% | 14.8 | 16.8 | 1.02 | - | - |
| PHM NYSE PulteGroup |
22.5B | -6.07% | 25.6% | 137% | 10.6 | 11.6 | 1.05 | 34.4% | 9.36% |
| GRBK NYSE Green Brick Partners |
2.85B | -3.0% | 18.9% | 170% | 9.24 | 10.6 | 1.15 | -23.4% | -49.6% |
| BLD NYSE Topbuild |
10.0B | -6.86% | 25.6% | 70.8% | 19.5 | 20.6 | - | -36.6% | -46.2% |
| SKY NYSE Skyline |
4.13B | -8.89% | -10.1% | 64.7% | 19.7 | 18.3 | - | -57.0% | -11.4% |
Performance: GRMN vs S&P 500
| PERIOD | GRMN | S&P 500 | DIFFERENCE |
|---|---|---|---|
| 1 Month | 0.10% | -1.73% | 1.86% |
| 3 Months | 16.42% | -4.49% | 21.89% |
| 6 Months | -5.00% | -1.33% | -3.72% |
| 12 Months | 36.45% | 32.14% | 3.26% |
| 5 Years | 99.37% | 72.70% | 15.44% |
GRMN Performance FAQ
Does GRMN outperform the market?
Yes, GRMN slightly outperforms the market. Over the past 12 months, GRMN returned 36.45% compared to 32.14% for the S&P 500.
What is the GRMN return over the last 12 months?
GRMN has returned 36.45% over the past 12 months, including dividends. Over 3 months the return was 16.42%, and over 5 years 99.37%.
How risky is GRMN?
GRMN has relatively low risk with a maximum drawdown of 27.97% over the past 3 years. The average drawdown is 6.28%.
GRMN vs Sectors (12m)
Sorted by outperformance. Positive = GRMN beats sector.
| SECTOR | ETF | DIFFERENCE 12M |
|---|---|---|
| Consumer Staples | XLP | 26.9% |
| Health Care | XLV | 25.7% |
| Real Estate | XLRE | 22.8% |
| Financials | XLF | 21.6% |
| Consumer Discretionary | XLY | 14.8% |
| Consumer Discretionary | XLY | 14.8% |
| Communication Services | XLC | 6.9% |
| Materials | XLB | 2.8% |
| Industrials | XLI | -5.7% |
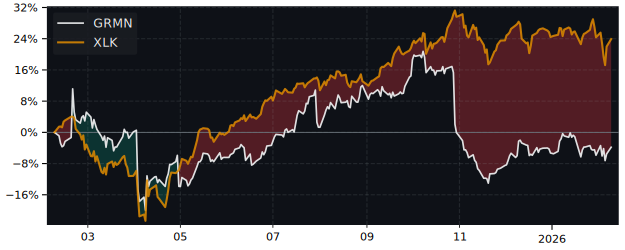
| Technology | XLK | -13.5% |
| Energy | XLE | -21% |
GRMN vs Asset Classes (12m)
| ASSET CLASS | ETF | DIFFERENCE 12M |
|---|---|---|
| S&P 500 | SPY | 3.26% |
| Gold | GLD | -19.8% |
| Long-Term Bonds | TLT | 35.9% |