IR Performance: 27% Return (12 Months)
IR returned 27.0% over 12 months, underperforming the S&P 500 (37.7%). Volatility: 32.5%.
RS IBD
3.65
Top 58% in Peers
Volatility
32.5%
Top 27% in Peers
Total Return 12m
26.97%
Top 61% in Peers
RS Rating
43.16
Top 58% in Peers
P/E
| P/E Trailing | 53.7 |
| P/E Forward | 21.9 |
High / Low 52w
| 52 Week High | 98.74 USD |
| 52 Week Low | 66.69 USD |
Sentiment
| VRO Trend Strength ±100 | 44.57 |
| Buy Signal ±3 | 0.50 |
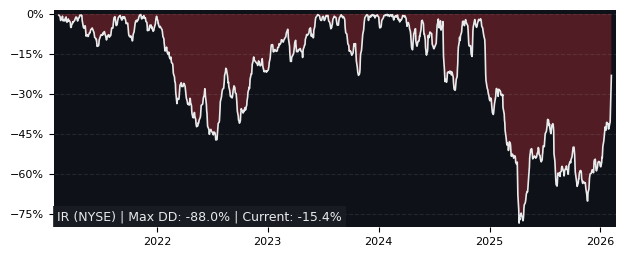
Drawdowns 3y
| Max Drawdown | 36.62% |
| Mean Drawdown | 10.98% |
Compare performance with 85 peers in Industrial Machinery & Supplies & Components
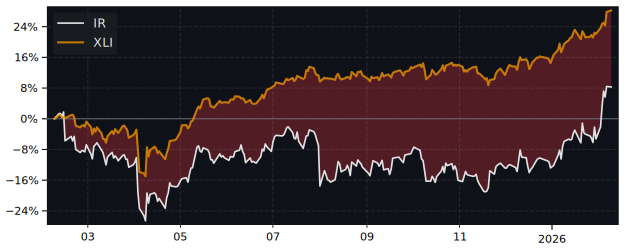
12m Total Return: IR (27%) vs PEER ETF
5y Drawdown (Underwater) Chart
Top Performer in Industrial Machinery & Supplies & Components (5/85)
Short Term Performance
| SYMBOL | 1W | 1M | 3M |
|---|---|---|---|
| PL | 19.02% | 41.56% | 62.88% |
| ESE | 5.42% | 14.00% | 47.78% |
| NDX1 | 1.52% | 10.96% | 40.27% |
| ENR | 8.66% | 11.18% | 34.54% |
| AZ | 8.02% | 49.35% | 5.21% |
| IR | 5.84% | -2.30% | 0.38% |
Long Term Performance
| SYMBOL | 6M | 12M | 5Y |
|---|---|---|---|
| PL | 134.29% | 1102.30% | 269.19% |
| NVRI | 68.20% | 304.30% | 9.61% |
| GHM | 59.03% | 236.51% | 562.24% |
| ENR | 53.22% | 224.26% | 468.45% |
| NDX1 | 93.71% | 206.80% | 109.43% |
| IR | 4.59% | 26.97% | 69.73% |
Overall Best Picks of Peer Group (GARP Metrics)
| SYMBOL | MCAP | 1M | 12M | 5Y | P/E | P/E fwd | PEG | EPS stab | EPS cagr |
|---|---|---|---|---|---|---|---|---|---|
| ESE NYSE ESCO Technologies |
7.57B | 14.0% | 121% | 182% | 60.6 | 25.4 | 1.67 | 74.8% | 28.0% |
| PH NYSE Parker-Hannifin |
115B | 3.63% | 85.6% | 221% | 33.1 | 27.3 | 3.74 | -22.4% | -44.9% |
| MWA NYSE Mueller Water Products |
4.32B | 3.75% | 28.6% | 118% | 21.8 | 19.1 | 1.27 | 81.7% | 19.2% |
| SPXC NYSE SPX |
9.81B | 1.15% | 75.9% | 253% | 38.6 | 25.1 | 1.40 | 20.4% | -39.7% |
| WTS NYSE Watts Water Technologies |
9.60B | -2.46% | 68.2% | 163% | 28.3 | 24.6 | 3.07 | 76.5% | 13.5% |
| DOV NYSE Dover |
27.7B | 2.70% | 44.9% | 64.2% | 25.8 | 19.5 | 1.82 | 58.8% | 7.71% |
| NDSN NASDAQ Nordson |
14.7B | 1.45% | 66.2% | 42.8% | 28.5 | 22.8 | 1.77 | 34.0% | -0.66% |
| SU PA Schneider Electric S.E. |
153B | 4.41% | 35.5% | 111% | 29.6 | 24.7 | 1.75 | -9.90% | - |
| SNA NYSE Snap-On |
19.0B | 1.89% | 26.4% | 83.2% | 19.1 | 18.3 | 2.03 | -35.7% | -46.0% |
| LECO NASDAQ Lincoln Electric Holdings |
13.4B | -4.34% | 54.2% | 124% | 26.2 | 22.6 | 1.61 | 68.2% | 6.40% |
Performance: IR vs S&P 500
Total Return vs S&P 500
| PERIOD | IR | S&P 500 |
|---|---|---|
| 1 Week | 5.84% | 3.17% |
| 1 Month | -2.30% | -0.06% |
| 3 Months | 0.38% | -1.69% |
| 6 Months | 4.59% | 1.00% |
| 12 Months | 26.97% | 37.72% |
| 5 Years | 69.73% | 75.84% |
IR Performance FAQ
Does IR outperform the market?
No, IR underperforms the market. Over the past 12 months, IR returned 26.97% compared to 37.72% for the S&P 500.
What is the IR return over the last 12 months?
IR has returned 26.97% over the past 12 months, including dividends. Over 3 months the return was 0.38%, and over 5 years 69.73%.
How risky is IR?
IR has relatively low risk with a maximum drawdown of 36.62% over the past 3 years. The average drawdown is 10.98%.
IR vs Sectors (12m)
Sorted by outperformance. Positive = IR beats sector.
Relative Performance vs S&P Sectors
| SECTOR | ETF | DIFFERENCE 12M |
|---|---|---|
| Consumer Staples | XLP | 15.6% |
| Health Care | XLV | 12.4% |
| Financials | XLF | 8.6% |
| Real Estate | XLRE | 8.5% |
| Consumer Discretionary | XLY | 0.3% |
| Consumer Discretionary | XLY | 0.3% |
| Communication Services | XLC | -6.8% |
| Materials | XLB | -15.1% |
| Industrials | XLI | -21.4% |
| Energy | XLE | -29.8% |
| Technology | XLK | -31.6% |
IR vs Asset Classes (12m)
Relative Performance vs Major Asset Classes
| ASSET CLASS | ETF | DIFFERENCE 12M |
|---|---|---|
| S&P 500 | SPY | -7.81% |
| Gold | GLD | -30.9% |
| Long-Term Bonds | TLT | 24.1% |