KN Performance Analysis: Knowles Cor | 101.8% 12M Return
12M Return: 101.8% | +81.3% vs S&P 500 | Relative Strength, Momentum & Peer Ranking
Detailed Performance Metrics Updated: 2026-07-04 09:15
| CAGR | 28.2% |
| CAGR / Max DD | 0.74 |
| CAGR / Mean DD | 2.99 |
| CAGR / Median DD | 3.36 |
| ATR % | 4.39% |
| Beta | 1.497 |
| Beta Downside | 1.311 |
| Alpha | 76.74% |
| CAPM | 11.25% |
| Current Price | 36.78 USD |
| SMA 20 Distance | +7.34% |
| SMA 50 Distance | -0.30% |
| SMA 200 Distance | -25.45% |
| RSI 14 | 42.7 |
| EMA8 Dist. Percentile | 0.0% |
| Distance to 52W High | -14.33% |
| Hurst Exponent | 0.483 |
| METRIC | KN | PERCENTILE RANK |
|---|---|---|
| RS IBD | 91.53 | 63.3 |
| Performance 1M | -4.94% | 36.7 |
| Performance 3M | 40.97% | 76.7 |
| Performance 6M | 64.27% | 70.0 |
| Performance 12M | 101.76% | 63.3 |
| Sharpe Ratio | 1.99 | 76.7 |
Top Performer in Electronic Components 5 of 15 peers
| SYMBOL | 1W | 1M | 3M |
|---|---|---|---|
| ATS | 4.81% | 33.05% | 246.15% |
| VSH | -23.35% | -28.10% | 145.18% |
| E28 | -1.01% | -4.23% | 42.10% |
| KN | -9.83% | -4.94% | 40.97% |
| ROG | -13.88% | -2.77% | 36.01% |
| APH | -0.34% | 11.66% | 30.32% |
| SYMBOL | 6M | 12M | 5Y |
|---|---|---|---|
| ATS | 500.00% | 1073.23% | 466.14% |
| GLW | 122.64% | 275.08% | 450.90% |
| VSH | 200.00% | 172.51% | 129.49% |
| BELFB | 51.97% | 167.16% | 1937.15% |
| E28 | 112.14% | 133.85% | 77.63% |
| KN | 64.27% | 101.76% | 88.42% |
Compare KN vs S&P 500
| PERIOD | KN | S&P 500 |
|---|---|---|
| 1 Week | -9.83% | 1.43% |
| 1 Month | -4.94% | -1.00% |
| 3 Months | 40.97% | 13.32% |
| 6 Months | 64.27% | 8.87% |
| 12 Months | 101.76% | 20.42% |
| 5 Years | 88.42% | 83.42% |
FAQ
Yes, KN significantly outperforms the market. Over the past 12 months, KN returned 101.76% compared to 20.42% for the S&P 500.
KN has returned 101.76% over the past 12 months, including dividends. Over 3 months the return was 40.97%, and over 5 years 88.42%.
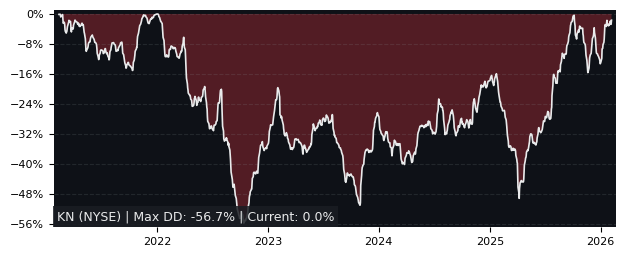
KN has relatively low risk with a maximum drawdown of 38.00% over the past 3 years. The average drawdown is 9.45%.
KN vs Sectors 12m
| SECTOR | ETF | DIFFERENCE 12M |
|---|---|---|
| Communication Services | XLC | 99% |
| Financials | XLF | 95.6% |
| Consumer Staples | XLP | 95.5% |
| Consumer Discretionary | XLY | 95% |
| Real Estate | XLRE | 91.2% |
| Real Estate | XLRE | 91.2% |
| Materials | XLB | 85.8% |
| Health Care | XLV | 78.8% |
| Industrials | XLI | 77.1% |
| Energy | XLE | 75.7% |
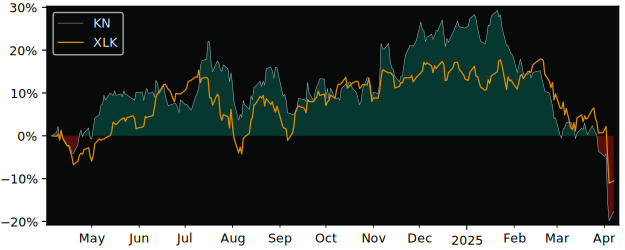
| Technology | XLK | 60.5% |
KN vs Asset Classes 12m
| ASSET CLASS | ETF | DIFFERENCE 12M |
|---|---|---|
| S&P 500 | SPY | 81.3% |
| Emerging Market | EEM | 64.4% |
| Gold | GLD | 78.7% |
| Long-Term Bonds | TLT | 99% |
| Risk-Free Cash | SHY | 98.7% |