(PLTR) Palantir Technologies - Performance 420.2% in 12m
PLTR performance: live returns, drawdowns, peer ranking & SPY comparison from 1w to 5y, all in one clean chart-driven dashboard.
Performance Rating
74.62%
#7 in Peer-Group
Rel. Strength
99.28%
#56 in Stock-Universe
Total Return 12m
420.23%
#2 in Peer-Group
Total Return 5y
1470.00%
#1 in Peer-Group
| P/E | Value |
|---|---|
| P/E Trailing | 620 |
| P/E Forward | 256 |
| High / Low | USD |
|---|---|
| 52 Week High | 149.15 USD |
| 52 Week Low | 24.09 USD |
| Sentiment | Value |
|---|---|
| VRO Trend Strength +-100 | 79.97 |
| Buy/Sell Signal +-5 | 2.77 |
| Support / Resistance | Levels |
|---|---|
| Support | 142.3, 131.7, 122.9, 98.9, 89.2 |
| Resistance |
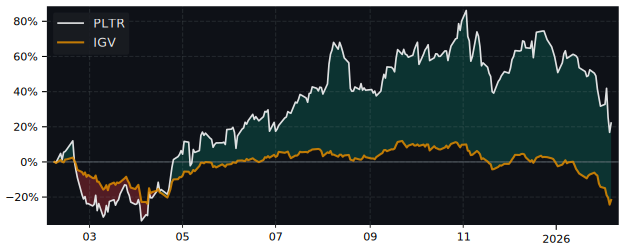
12m Total Return: PLTR (420.2%) vs SPY (12.7%)
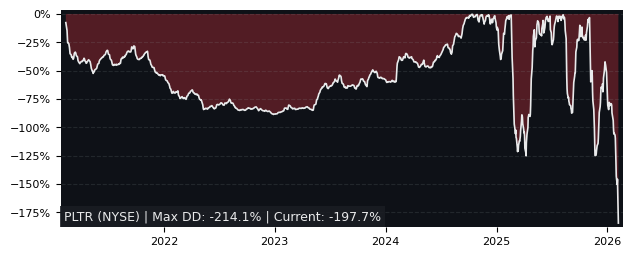
5y Drawdown (Underwater) Chart
Top Performer in Systems Software
Overall best picks of Peer Group - Selected by proven GARP Predictive Metrics, sorted by Growth Rating
| Symbol | 1m | 12m | 5y | P/E | P/E Forward | PEG | EPS Stability | EPS CAGR |
|---|
Performance Comparison: PLTR vs SPY vs S&P 500
SPY (SPDR SP500 Trust ETF) is the Sector Benchmark for PLTR
| Total Return (including Dividends) | PLTR | SPY | S&P 500 |
|---|---|---|---|
| 1 Month | 5.47% | 3.98% | 3.98% |
| 3 Months | 61.03% | 16.24% | 16.24% |
| 12 Months | 420.23% | 12.66% | 12.66% |
| 5 Years | 1470.00% | 109.18% | 109.18% |
| Trend Score (consistency of price movement) | PLTR | SPY | S&P 500 |
|---|---|---|---|
| 1 Month | 23.2% | 91.4% | 91.4% |
| 3 Months | 91.9% | 97.5% | 97.5% |
| 12 Months | 97.3% | 46.7% | 46.7% |
| 5 Years | 39.2% | 84% | 84% |
| Relative Strength (compared with Indexes) | Rank in Peer Group | vs. SPY | vs. S&P 500 |
|---|---|---|---|
| 1 Month | %th71.43 | 1.44% | 1.44% |
| 3 Month | %th89.80 | 38.54% | 38.54% |
| 12 Month | %th100.00 | 361.78% | 361.78% |
| 5 Years | %th100.00 | 686.66% | 686.66% |
FAQs
Does Palantir Technologies (PLTR) outperform the market?
Yes,
over the last 12 months PLTR made 420.23%, while its related Sector, the SPDR SP500 Trust (SPY) made 12.66%.
Over the last 3 months PLTR made 61.03%, while SPY made 16.24%.
Performance Comparison PLTR vs Indeces and Sectors
Above 0 means better perfomance compared to Symbol in this Timeframe
PLTR vs. Indices
| Symbol | 1w | 1m | 6m | 12m | |
|---|---|---|---|---|---|
| US S&P 500 | SPY | 6.5% | 1.5% | 118.3% | 408% |
| US NASDAQ 100 | QQQ | 6.5% | 1.3% | 115.9% | 407% |
| German DAX 40 | DAX | 6.8% | 3.5% | 107.7% | 391% |
| Shanghai Shenzhen CSI 300 | CSI 300 | 5% | 0.3% | 116.4% | 400% |
| Hongkong Hang Seng | HSI | 5.8% | 2.9% | 97% | 386% |
| India NIFTY 50 | INDA | 8% | 4.8% | 118.5% | 423% |
| Brasil Bovespa | EWZ | 11.7% | 9% | 105.2% | 420% |
PLTR vs. Sectors
| Symbol | 1w | 1m | 6m | 12m | |
|---|---|---|---|---|---|
| Communication Services | XLC | 7.2% | 2.6% | 113.6% | 395% |
| Consumer Discretionary | XLY | 5.5% | 1.4% | 125.5% | 403% |
| Consumer Staples | XLP | 8.7% | 5.2% | 119.3% | 413% |
| Energy | XLE | 4.9% | 4.3% | 128.1% | 421% |
| Financial | XLF | 7.5% | 1.1% | 116.6% | 396% |
| Health Care | XLV | 6.7% | 5.5% | 129% | 427% |
| Industrial | XLI | 5.8% | 0% | 113.3% | 398% |
| Materials | XLB | 6.6% | 1.7% | 119.7% | 417% |
| Real Estate | XLRE | 6.3% | 4.8% | 120.1% | 413% |
| Technology | XLK | 6.9% | 0.1% | 113.7% | 410% |
| Utilities | XLU | 6.3% | 2.6% | 115.4% | 398% |
| Aerospace & Defense | XAR | 4.2% | -4.4% | 97.8% | 370% |
| Biotech | XBI | 1.6% | -0.4% | 124.4% | 432% |
| Homebuilder | XHB | 4.4% | -3.8% | 128.6% | 424% |
| Retail | XRT | 6.1% | 0.3% | 121.6% | 413% |
PLTR vs. Commodities
| Symbol | 1w | 1m | 6m | 12m | |
|---|---|---|---|---|---|
| Oil | USO | 8.3% | 9.25% | 134% | 426% |
| Natural Gas | UNG | 6% | 15.4% | 143.5% | 415% |
| Gold | GLD | 7% | 6.7% | 101.6% | 383% |
| Silver | SLV | 3.6% | 0.6% | 99% | 397% |
| Copper | CPER | -2.8% | -8% | 100.5% | 398% |
PLTR vs. Bonds
| Symbol | 1w | 1m | 6m | 12m | |
|---|---|---|---|---|---|
| iShares 20+ Years Bond | TLT | 7.8% | 4.9% | 123.7% | 424% |
| iShares High Yield Corp. Bond | HYG | 7.2% | 4.3% | 121.5% | 411% |