(ASM) Avino Silver & Gold - Performance 200% in 12m
Compare ASM with Indices, Sectors and Commodities and Bonds. Who performs better in which timeframe?
Performance Rating
49.04%
#33 in Peer-Group
Rel. Strength
98.74%
#101 in Stock-Universe
Total Return 12m
200.00%
#10 in Peer-Group
Total Return 5y
360.27%
#21 in Peer-Group
| P/E | Value |
|---|---|
| P/E Trailing | 45.3 |
| P/E Forward | 34.7 |
| High / Low | CAD |
|---|---|
| 52 Week High | 3.62 CAD |
| 52 Week Low | 1.18 CAD |
| Sentiment | Value |
|---|---|
| VRO Trend Strength +-100 | 75.46 |
| Buy/Sell Signal +-5 | -0.50 |
| Support / Resistance | Levels |
|---|---|
| Support | |
| Resistance |
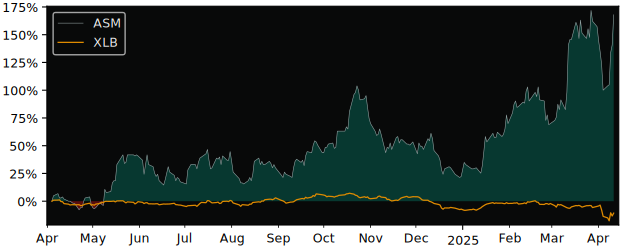
12m Total Return: ASM (200%) vs XLB (-4.4%)
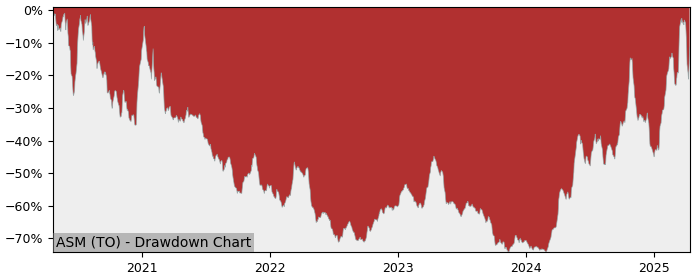
5y Drawdown (Underwater) Chart
Top Performer in Diversified Metals & Mining
Overall best picks of Peer Group - Selected by proven GARP Predictive Metrics, sorted by Growth Rating
Performance Comparison: ASM vs XLB vs S&P 500
XLB (Materials Sector SPDR Fund ETF) is the Sector Benchmark for ASM
| Total Return (including Dividends) | ASM | XLB | S&P 500 |
|---|---|---|---|
| 1 Month | 20.00% | 5.67% | 8.85% |
| 3 Months | 60.77% | -4.06% | -3.46% |
| 12 Months | 200.00% | -4.38% | 14.09% |
| 5 Years | 360.27% | 86.97% | 120.47% |
| Trend Score (consistency of price movement) | ASM | XLB | S&P 500 |
|---|---|---|---|
| 1 Month | 89.7% | 90.1% | 92.5% |
| 3 Months | 88% | -73.5% | -60% |
| 12 Months | 79.9% | -46.7% | 48.5% |
| 5 Years | -2.5% | 76.8% | 84.1% |
| Relative Strength (compared with Indexes) | Rank in Peer Group | vs. XLB | vs. S&P 500 |
|---|---|---|---|
| 1 Month | #24 | 13.56% | 10.24% |
| 3 Month | #19 | 67.57% | 66.54% |
| 12 Month | #11 | 213.75% | 162.95% |
| 5 Years | #20 | 146.18% | 108.77% |
FAQs
Does Avino Silver & Gold (ASM) outperform the market?
Yes,
over the last 12 months ASM made 200.00%, while its related Sector, the Materials Sector SPDR Fund (XLB) made -4.38%.
Over the last 3 months ASM made 60.77%, while XLB made -4.06%.
Performance Comparison ASM vs Indeces and Sectors
Above 0 means better perfomance compared to Symbol in this Timeframe
ASM vs. Indices
| Symbol | 1w | 1m | 6m | 12m | |
|---|---|---|---|---|---|
| US S&P 500 | SPY | -6.5% | 11.2% | 122.2% | 186% |
| US NASDAQ 100 | QQQ | -8.6% | 7.3% | 120.1% | 183% |
| German DAX 40 | DAX | -3% | 7.4% | 97% | 174% |
| Shanghai Shenzhen CSI 300 | CSI 300 | -3.5% | 14.8% | 124.3% | 192% |
| Hongkong Hang Seng | HSI | -4.1% | 5.8% | 111% | 190% |
| India NIFTY 50 | INDA | -2.1% | 14.2% | 118.9% | 195% |
| Brasil Bovespa | EWZ | -7.9% | 6.7% | 113.4% | 204% |
ASM vs. Sectors
| Symbol | 1w | 1m | 6m | 12m | |
|---|---|---|---|---|---|
| Communication Services | XLC | -4.1% | 11% | 117.4% | 176% |
| Consumer Discretionary | XLY | -10.4% | 6.9% | 122% | 178% |
| Consumer Staples | XLP | 0.3% | 22.2% | 120.9% | 194% |
| Energy | XLE | -8% | 11.7% | 128.8% | 205% |
| Financial | XLF | -5.4% | 11.7% | 117.6% | 175% |
| Health Care | XLV | 0.4% | 24.8% | 130.5% | 207% |
| Industrial | XLI | -7.3% | 8.7% | 120.9% | 185% |
| Materials | XLB | -4.3% | 14.3% | 127.2% | 204% |
| Real Estate | XLRE | -0.3% | 16.7% | 124.6% | 188% |
| Technology | XLK | -10.3% | 3.8% | 121.9% | 187% |
| Utilities | XLU | -0.4% | 17.5% | 117.8% | 185% |
| Aerospace & Defense | XAR | -5.7% | 8.3% | 113.8% | 170% |
| Biotech | XBI | -2% | 18.7% | 143.5% | 214% |
| Homebuilder | XHB | -8.1% | 9.8% | 133.7% | 204% |
| Retail | XRT | -8.5% | 8.4% | 126.6% | 201% |
ASM vs. Commodities
| Symbol | 1w | 1m | 6m | 12m | |
|---|---|---|---|---|---|
| Oil | USO | -9.2% | 15.6% | 123% | 209% |
| Natural Gas | UNG | -6.2% | 16.1% | 92.1% | 195% |
| Gold | GLD | 3.6% | 18.9% | 95% | 162% |
| Silver | SLV | -0.5% | 18.1% | 112.7% | 184% |
| Copper | CPER | -0.6% | 20% | 106.4% | 200% |
ASM vs. Bonds
| Symbol | 1w | 1m | 6m | 12m | |
|---|---|---|---|---|---|
| iShares 20+ Years Bond | TLT | 0.4% | 21.5% | 123.3% | 201% |
| iShares High Yield Corp. Bond | HYG | -2.8% | 16.4% | 118% | 190% |