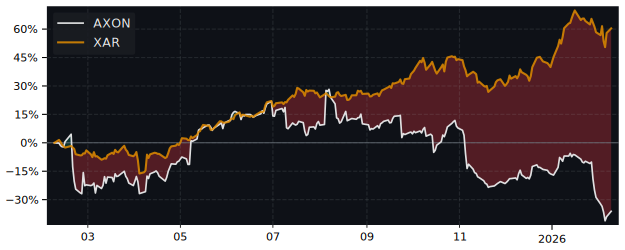
AXON Performance: -17.8% Return (12 Months)
AXON returned -17.8% over 12 months, underperforming the S&P 500 (32.1%). Volatility: 80.3%.
| P/E Trailing | 270 |
| P/E Forward | 56.8 |
| 52 Week High | 870.97 USD |
| 52 Week Low | 399.65 USD |
| VRO Trend Strength ±100 | 14.09 |
| Buy Signal ±3 | -1.61 |
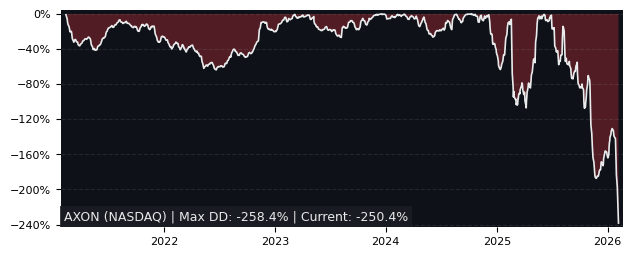
| Max Drawdown | 54.11% |
| Mean Drawdown | 12.51% |
Top Performer in Aerospace & Defense (5/53)
| SYMBOL | 1W | 1M | 3M |
|---|---|---|---|
| ESLT | 13.09% | -1.33% | 44.31% |
| EXA | 13.87% | 5.72% | 39.71% |
| FLY | 47.54% | 76.63% | 31.76% |
| PKE | 8.57% | 8.32% | 31.43% |
| AIR | 10.51% | 5.05% | 27.43% |
| AXON | -0.48% | -28.04% | -34.08% |
| SYMBOL | 6M | 12M | 5Y |
|---|---|---|---|
| ISSC | 75.65% | 282.22% | 246.29% |
| EXA | 41.49% | 277.84% | 1029.23% |
| ATRO | 48.12% | 229.51% | 288.64% |
| KRMN | 16.01% | 221.63% | 186.52% |
| ESLT | 76.01% | 154.72% | 566.40% |
| AXON | -42.76% | -17.81% | 174.34% |
| SYMBOL | MCAP | 1M | 12M | 5Y | P/E | P/E fwd | PEG | EPS stab | EPS cagr |
|---|---|---|---|---|---|---|---|---|---|
| CW NYSE Curtiss-Wright |
25.6B | 2.59% | 143% | 476% | 54.0 | 28.4 | 2.0 | -3.40% | -42.0% |
| ESLT NASDAQ Elbit Systems |
41.4B | -1.33% | 155% | 566% | 78.3 | 9.66 | 8.79 | 90.1% | 33.1% |
| HWM NYSE MKT Howmet Aerospace |
93.7B | -5.42% | 105% | 654% | 62.9 | 52.1 | 0.80 | 99.1% | 38.5% |
| ISSC NASDAQ Innovative Solutions Support |
400M | -17.1% | 282% | 246% | 21.3 | 9.50 | 0.83 | 43.8% | -46.6% |
| BSP XETRA BAE Systems |
88.9B | 2.61% | 52.4% | 393% | 33.8 | 25.9 | 3.62 | - | - |
| ATRO NASDAQ Astronics |
2.49B | -5.95% | 230% | 289% | 86.2 | 27.2 | 1.45 | 73.2% | 37.6% |
| GE NYSE GE Aerospace |
297B | -10.5% | 73.1% | 341% | 35.0 | 39.4 | 5.04 | 76.0% | 65.0% |
Performance: AXON vs S&P 500
| PERIOD | AXON | S&P 500 | DIFFERENCE |
|---|---|---|---|
| 1 Month | -28.04% | -1.73% | -26.77% |
| 3 Months | -34.08% | -4.49% | -30.98% |
| 6 Months | -42.76% | -1.33% | -41.98% |
| 12 Months | -17.81% | 32.14% | -37.80% |
| 5 Years | 174.34% | 72.70% | 58.85% |
AXON Performance FAQ
Does AXON outperform the market?
No, AXON underperforms the market. Over the past 12 months, AXON returned -17.81% compared to 32.14% for the S&P 500.
What is the AXON return over the last 12 months?
AXON has returned -17.81% over the past 12 months, including dividends. Over 3 months the return was -34.08%, and over 5 years 174.34%.
How risky is AXON?
AXON has relatively low risk with a maximum drawdown of 54.11% over the past 3 years. The average drawdown is 12.51%.
AXON vs Sectors (12m)
Sorted by outperformance. Positive = AXON beats sector.
| SECTOR | ETF | DIFFERENCE 12M |
|---|---|---|
| Consumer Staples | XLP | -27.4% |
| Health Care | XLV | -28.5% |
| Real Estate | XLRE | -31.5% |
| Financials | XLF | -32.7% |
| Consumer Discretionary | XLY | -39.5% |
| Consumer Discretionary | XLY | -39.5% |
| Communication Services | XLC | -47.3% |
| Materials | XLB | -51.5% |
| Industrials | XLI | -59.9% |
| Technology | XLK | -67.8% |
| Energy | XLE | -75.2% |
AXON vs Asset Classes (12m)
| ASSET CLASS | ETF | DIFFERENCE 12M |
|---|---|---|
| S&P 500 | SPY | -37.80% |
| Gold | GLD | -74.1% |
| Long-Term Bonds | TLT | -18.4% |