LOGI Performance: 30.6% Return (12 Months)
LOGI returned 30.6% over 12 months, outperforming the S&P 500 (23.6%). Volatility: 32.2%.
| P/E Trailing | 18.9 |
| P/E Forward | 11.7 |
| 52 Week High | 122.99 USD |
| 52 Week Low | 64.68 USD |
| VRO Trend Strength ±100 | 36.54 |
| Buy Signal ±3 | -0.08 |
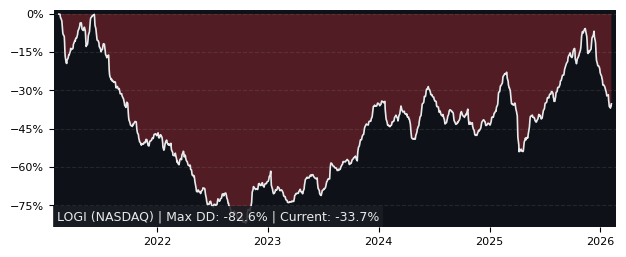
| Max Drawdown | 37.59% |
| Mean Drawdown | 10.12% |
Top Performer in Technology Hardware, Storage & Peripherals (5/20)
| SYMBOL | 1W | 1M | 3M |
|---|---|---|---|
| AL2SI | 16.67% | 33.80% | 156.71% |
| SNDK | 13.93% | 24.09% | 155.98% |
| WDC | 7.13% | 17.76% | 57.07% |
| STX | 12.97% | 20.27% | 48.40% |
| KODK | 18.92% | 67.16% | 33.61% |
| LOGI | 2.15% | 0.41% | -7.57% |
| SYMBOL | 6M | 12M | 5Y |
|---|---|---|---|
| SNDK | 446.37% | 1733.74% | 1848.86% |
| WDC | 124.92% | 767.48% | 444.04% |
| AL2SI | 107.97% | 701.68% | 560.82% |
| STX | 70.59% | 507.99% | 533.90% |
| KODK | 66.91% | 99.82% | 34.89% |
| LOGI | -18.58% | 30.58% | -7.79% |
| SYMBOL | MCAP | 1M | 12M | 5Y | P/E | P/E fwd | PEG | EPS stab | EPS cagr |
|---|---|---|---|---|---|---|---|---|---|
| STX NASDAQ Seagate Technology |
85.1B | 20.3% | 508% | 534% | 42.9 | 23.3 | 0.64 | 52.0% | -36.4% |
| AL2SI PA 2CRSI S.A. |
643M | 33.8% | 702% | 561% | 246 | - | - | 61.2% | 98.4% |
| WDC NASDAQ Western Digital |
86.0B | 17.8% | 767% | 444% | 23.8 | 27.0 | 0.69 | 58.9% | 140% |
| AAPL NASDAQ Apple |
3,757B | -2.97% | 26.5% | 109% | 32.4 | 29.7 | 2.27 | 44.8% | 18.1% |
| PSTG NYSE Pure Storage |
19.5B | 1.20% | 53.0% | 184% | 107 | 26.6 | 1.33 | 30.8% | 31.1% |
Performance: LOGI vs S&P 500
| PERIOD | LOGI | S&P 500 | DIFFERENCE |
|---|---|---|---|
| 1 Month | 0.41% | -3.34% | 3.88% |
| 3 Months | -7.57% | -4.38% | -3.34% |
| 6 Months | -18.58% | -1.44% | -17.39% |
| 12 Months | 30.58% | 23.60% | 5.65% |
| 5 Years | -7.79% | 72.80% | -46.64% |
LOGI Performance FAQ
Does LOGI outperform the market?
Yes, LOGI significantly outperforms the market. Over the past 12 months, LOGI returned 30.58% compared to 23.60% for the S&P 500.
What is the LOGI return over the last 12 months?
LOGI has returned 30.58% over the past 12 months, including dividends. Over 3 months the return was -7.57%, and over 5 years -7.79%.
How risky is LOGI?
LOGI has relatively low risk with a maximum drawdown of 37.59% over the past 3 years. The average drawdown is 10.12%.
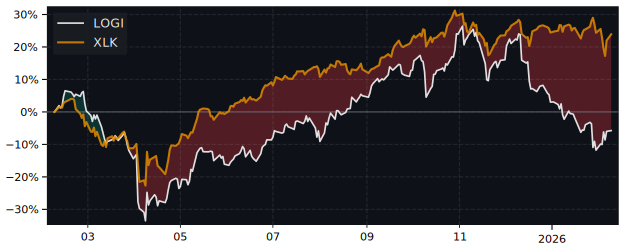
LOGI vs Sectors (12m)
Sorted by outperformance. Positive = LOGI beats sector.
| SECTOR | ETF | DIFFERENCE 12M |
|---|---|---|
| Consumer Staples | XLP | 28% |
| Health Care | XLV | 26.2% |
| Financials | XLF | 25.1% |
| Real Estate | XLRE | 25.1% |
| Consumer Discretionary | XLY | 16.5% |
| Consumer Discretionary | XLY | 16.5% |
| Communication Services | XLC | 8.4% |
| Materials | XLB | 6.9% |
| Industrials | XLI | -1.3% |
| Technology | XLK | -9.5% |
| Energy | XLE | -10.4% |
LOGI vs Asset Classes (12m)
| ASSET CLASS | ETF | DIFFERENCE 12M |
|---|---|---|
| S&P 500 | SPY | 5.65% |
| Gold | GLD | -19.3% |
| Long-Term Bonds | TLT | 31.8% |