SLAB Performance: 111% Return (12 Months)
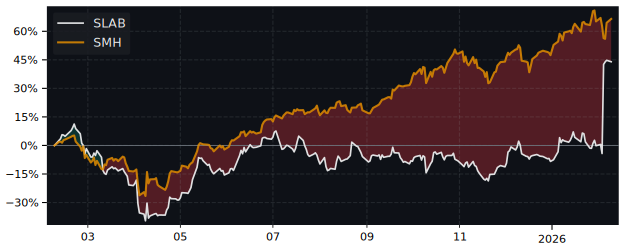
SLAB returned 111.0% over 12 months, outperforming the S&P 500 (23.6%). Volatility: 48.9%.
RS (IBD)
52.07
Top 18% in Peers
Volatility
48.9%
Top 32% in Peers
Total Return 12m
110.99%
Top 31% in Peers
RS Rating
93.23
Top 18% in Peers
| P/E | Value |
|---|---|
| P/E Trailing | 0.00 |
| P/E Forward | 75.8 |
| High / Low | USD |
|---|---|
| 52 Week High | 208.15 USD |
| 52 Week Low | 86.17 USD |
| Sentiment | Value |
|---|---|
| VRO Trend Strength +-100 | 84.00 |
| Buy Signal +-3 | 0.84 |
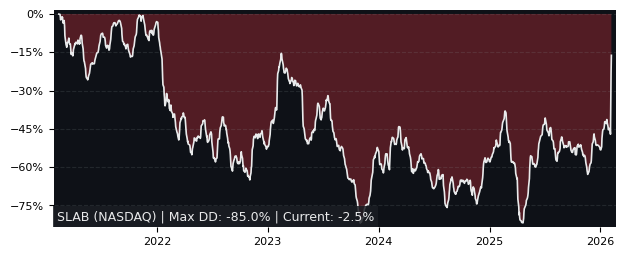
| Drawdowns | in 3y |
|---|---|
| Max Drawdown | 50.31% |
| Mean Drawdown | 24.95% |
Peer Group: Semiconductors (54 symbols)
12m Total Return: SLAB (111%) vs SPY (23.6%)
5y Drawdown (Underwater) Chart
Top Performer in Semiconductors (5/54)
Short Term Performance
| Symbol | 1w | 1m | 3m |
|---|---|---|---|
| SLAB | 1.55% | 2.70% | 51.62% |
| TSEM | 15.05% | 57.57% | 65.81% |
| S92 | 2.80% | 63.92% | 29.19% |
| QUIK | 4.41% | 27.73% | 47.19% |
| MRVL | 12.89% | 38.19% | 18.79% |
| ARM | 3.46% | 22.50% | 28.42% |
Long Term Performance
| Symbol | 6m | 12m | 5y |
|---|---|---|---|
| SLAB | 55.74% | 110.99% | 39.65% |
| TSEM | 171.82% | 525.95% | 556.49% |
| SKYT | 54.44% | 343.97% | 59.92% |
| S92 | 100.67% | 244.68% | -6.17% |
| ASX | 101.08% | 181.56% | 260.69% |
| MTSI | 87.03% | 158.54% | 297.83% |
Performance: SLAB vs S&P 500
| Total Return | SLAB | S&P 500 | Difference |
|---|---|---|---|
| 1 Month | 2.70% | -3.34% | 6.24% |
| 3 Months | 51.62% | -4.38% | 58.6% |
| 6 Months | 55.74% | -1.44% | 58.0% |
| 12 Months | 110.99% | 23.60% | 70.7% |
| 5 Years | 39.65% | 72.80% | -19.2% |
FAQs
Does SLAB outperform the market?
Yes, SLAB significantly outperforms the market.
Over the past 12 months, SLAB returned 110.99% compared to 23.60% for the S&P 500.
What is the SLAB return over the last 12 months?
SLAB has returned 110.99% over the past 12 months, including dividends.
Over 3 months the return was 51.62%, and over 5 years 39.65%.
How risky is SLAB?
SLAB has relatively low risk with a maximum drawdown of 50.31% over the past 3 years.
The average drawdown is 24.95%.
SLAB vs Sectors (12m)
Sorted by outperformance. Positive = SLAB beats sector.
| Sector | ETF | Difference |
|---|---|---|
| Consumer Staples | XLP | 108% |
| Health Care | XLV | 107% |
| Financials | XLF | 106% |
| Real Estate | XLRE | 106% |
| Consumer Discretionary | XLY | 96.9% |
| Consumer Discretionary | XLY | 96.9% |
| Communication Services | XLC | 88.8% |
| Materials | XLB | 87.3% |
| Industrials | XLI | 79.1% |
| Technology | XLK | 70.9% |
| Energy | XLE | 70.0% |
SLAB vs Asset Classes (12m)
| Asset Class | ETF | Difference |
|---|---|---|
| S&P 500 | SPY | 70.7% |
| Gold | GLD | 61.1% |
| Long-Term Bonds | TLT | 112% |