SSYS Performance: -11.6% Return (12 Months)
SSYS returned -11.6% over 12 months, underperforming the S&P 500 (32.2%). Volatility: 51.2%.
| P/E Trailing | 0.00 |
| P/E Forward | 30.1 |
| 52 Week High | 12.44 USD |
| 52 Week Low | 7.42 USD |
| VRO Trend Strength ±100 | 27.41 |
| Buy Signal ±3 | -0.63 |
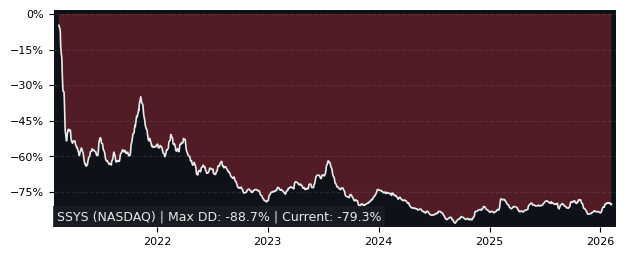
| Max Drawdown | 71.08% |
| Mean Drawdown | 46.49% |
Top Performer in Technology Hardware, Storage & Peripherals (5/22)
| SYMBOL | 1W | 1M | 3M |
|---|---|---|---|
| AL2SI | 2.22% | 22.67% | 175.82% |
| SNDK | 11.88% | 20.73% | 101.04% |
| WDC | 15.33% | 19.04% | 56.15% |
| STX | 19.64% | 25.43% | 52.32% |
| KODK | 24.97% | 65.59% | 39.46% |
| SSYS | 2.82% | -6.52% | -20.34% |
| SYMBOL | 6M | 12M | 5Y |
|---|---|---|---|
| SNDK | 487.68% | 2157.94% | 1874.44% |
| WDC | 160.45% | 905.48% | 468.36% |
| AL2SI | 106.67% | 733.92% | 564.04% |
| STX | 109.22% | 591.47% | 580.58% |
| KODK | 71.10% | 100.53% | 42.98% |
| SSYS | -30.48% | -11.56% | -66.25% |
| SYMBOL | MCAP | 1M | 12M | 5Y | P/E | P/E fwd | PEG | EPS stab | EPS cagr |
|---|---|---|---|---|---|---|---|---|---|
| STX NASDAQ Seagate Technology |
96.2B | 25.4% | 591% | 581% | 48.6 | 23.9 | 0.65 | 52.2% | -36.4% |
| WDC NASDAQ Western Digital |
101B | 19.0% | 905% | 468% | 27.9 | 23.3 | 0.60 | 44.2% | 7.05% |
| AAPL NASDAQ Apple |
3,761B | -2.45% | 40.3% | 95.7% | 32.4 | 29.8 | 2.27 | 44.8% | 18.1% |
| PSTG NYSE Pure Storage |
20.6B | -1.56% | 60.8% | 186% | 114 | 27.5 | 1.38 | 48.2% | 31.1% |
| LOGI NASDAQ Logitech International |
13.6B | 0.44% | 38.0% | -6.61% | 19.3 | 12.4 | 1.29 | 16.3% | -41.9% |
Performance: SSYS vs S&P 500
| PERIOD | SSYS | S&P 500 | DIFFERENCE |
|---|---|---|---|
| 1 Month | -6.52% | -2.54% | -4.08% |
| 3 Months | -20.34% | -4.14% | -16.90% |
| 6 Months | -30.48% | -0.92% | -29.83% |
| 12 Months | -11.56% | 32.20% | -33.10% |
| 5 Years | -66.25% | 71.53% | -80.32% |
SSYS Performance FAQ
Does SSYS outperform the market?
No, SSYS underperforms the market. Over the past 12 months, SSYS returned -11.56% compared to 32.20% for the S&P 500.
What is the SSYS return over the last 12 months?
SSYS has returned -11.56% over the past 12 months, including dividends. Over 3 months the return was -20.34%, and over 5 years -66.25%.
How risky is SSYS?
SSYS has relatively low risk with a maximum drawdown of 71.08% over the past 3 years. The average drawdown is 46.49%.
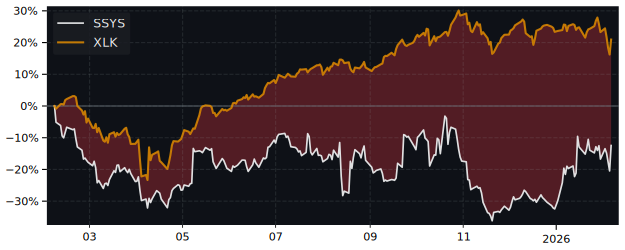
SSYS vs Sectors (12m)
Sorted by outperformance. Positive = SSYS beats sector.
| SECTOR | ETF | DIFFERENCE 12M |
|---|---|---|
| Consumer Staples | XLP | -19.2% |
| Health Care | XLV | -22.5% |
| Real Estate | XLRE | -25.1% |
| Financials | XLF | -26.4% |
| Consumer Discretionary | XLY | -31.8% |
| Communication Services | XLC | -41.2% |
| Communication Services | XLC | -41.2% |
| Materials | XLB | -44.8% |
| Industrials | XLI | -53.4% |
| Technology | XLK | -62.2% |
| Energy | XLE | -70.3% |
SSYS vs Asset Classes (12m)
| ASSET CLASS | ETF | DIFFERENCE 12M |
|---|---|---|
| S&P 500 | SPY | -33.10% |
| Gold | GLD | -69.3% |
| Long-Term Bonds | TLT | -12.1% |