WB Performance: 25.9% Return (12 Months)
WB returned 25.9% over 12 months, underperforming the S&P 500 (37.7%). Volatility: 24.7%.
| P/E Trailing | 5.16 |
| P/E Forward | 5.71 |
| 52 Week High | 12.83 USD |
| 52 Week Low | 7.03 USD |
| VRO Trend Strength ±100 | 27.21 |
| Buy Signal ±3 | -0.17 |
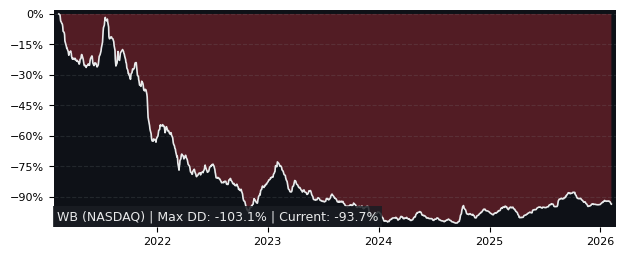
| Max Drawdown | 52.96% |
| Mean Drawdown | 31.24% |
Top Performer in Interactive Media & Services (5/30)
| SYMBOL | 1W | 1M | 3M |
|---|---|---|---|
| IAC | 1.18% | 8.24% | 3.19% |
| MTCH | 5.67% | 5.77% | 0.78% |
| BMBL | 4.80% | 17.91% | -0.85% |
| GOOGL | 6.70% | 3.58% | -2.43% |
| GOOG | 6.73% | 2.85% | -3.39% |
| WB | 0.91% | -8.20% | -17.37% |
| SYMBOL | 6M | 12M | 5Y |
|---|---|---|---|
| GOOGL | 29.90% | 120.06% | 185.08% |
| GOOG | 28.40% | 115.46% | 181.47% |
| JOYY | 6.24% | 71.42% | -20.51% |
| CARG | -0.58% | 37.24% | 44.28% |
| WB | -29.93% | 25.89% | -76.44% |
| IAC | 21.33% | 23.75% | -69.64% |
| SYMBOL | MCAP | 1M | 12M | 5Y | P/E | P/E fwd | PEG | EPS stab | EPS cagr |
|---|---|---|---|---|---|---|---|---|---|
| CARG NASDAQ CarGurus |
3.36B | 2.13% | 37.2% | 44.3% | 18.0 | 13.0 | 1.0 | 40.2% | -46.3% |
| YALA NYSE Yalla |
1.01B | -8.44% | 29.7% | -71.8% | 7.66 | 14.2 | 0.59 | 9.30% | -45.6% |
| META NASDAQ Meta Platforms |
1,453B | -5.32% | 20.4% | 98.1% | 24.5 | 19.4 | 0.95 | 85.1% | 37.1% |
| RDDT NYSE |
26.0B | 4.42% | 63.1% | 326% | 52.1 | 33.3 | 1.10 | 59.9% | 143% |
| MTCH NASDAQ Match |
7.42B | 5.77% | 23.9% | -76.6% | 13.2 | 7.92 | 0.28 | 28.5% | 8.90% |
| WB NASDAQ |
2.16B | -8.20% | 25.9% | -76.4% | 5.16 | 5.71 | 4.85 | -59.7% | -47.1% |
Performance: WB vs S&P 500
| PERIOD | WB | S&P 500 |
|---|---|---|
| 1 Week | 0.91% | 3.17% |
| 1 Month | -8.20% | -0.06% |
| 3 Months | -17.37% | -1.69% |
| 6 Months | -29.93% | 1.00% |
| 12 Months | 25.89% | 37.72% |
| 5 Years | -76.44% | 75.84% |
WB Performance FAQ
Does WB outperform the market?
No, WB underperforms the market. Over the past 12 months, WB returned 25.89% compared to 37.72% for the S&P 500.
What is the WB return over the last 12 months?
WB has returned 25.89% over the past 12 months, including dividends. Over 3 months the return was -17.37%, and over 5 years -76.44%.
How risky is WB?
WB has relatively low risk with a maximum drawdown of 52.96% over the past 3 years. The average drawdown is 31.24%.
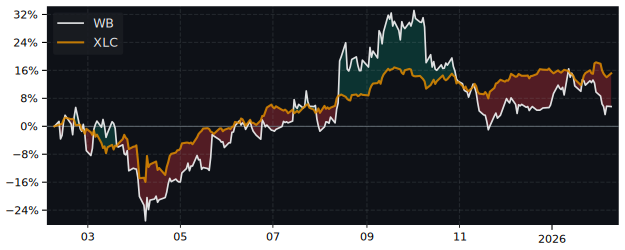
WB vs Sectors (12m)
Sorted by outperformance. Positive = WB beats sector.
| SECTOR | ETF | DIFFERENCE 12M |
|---|---|---|
| Consumer Staples | XLP | 14.5% |
| Health Care | XLV | 11.3% |
| Financials | XLF | 7.5% |
| Real Estate | XLRE | 7.5% |
| Consumer Discretionary | XLY | -0.8% |
| Consumer Discretionary | XLY | -0.8% |
| Communication Services | XLC | -7.9% |
| Materials | XLB | -16.2% |
| Industrials | XLI | -22.5% |
| Energy | XLE | -30.9% |
| Technology | XLK | -32.7% |
WB vs Asset Classes (12m)
| ASSET CLASS | ETF | DIFFERENCE 12M |
|---|---|---|
| S&P 500 | SPY | -8.59% |
| Gold | GLD | -32% |
| Long-Term Bonds | TLT | 23% |