BB Performance: 23% Return (12 Months)
BB returned 23.0% over 12 months, underperforming the S&P 500 (37.7%). Volatility: 44.3%.
RS IBD
-46.05
Top 28% in Peers
Volatility
44.3%
Top 30% in Peers
Total Return 12m
23.00%
Top 31% in Peers
RS Rating
20.81
Top 28% in Peers
P/E
| P/E Trailing | 87.0 |
| P/E Forward | 21.0 |
High / Low 52w
| 52 Week High | 5.00 USD |
| 52 Week Low | 2.87 USD |
Sentiment
| VRO Trend Strength ±100 | 75.36 |
| Buy Signal ±3 | -1.24 |
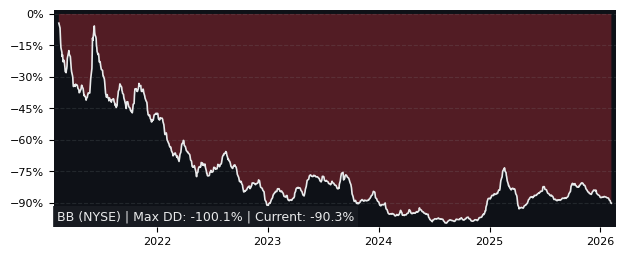
Drawdowns 3y
| Max Drawdown | 62.32% |
| Mean Drawdown | 35.46% |
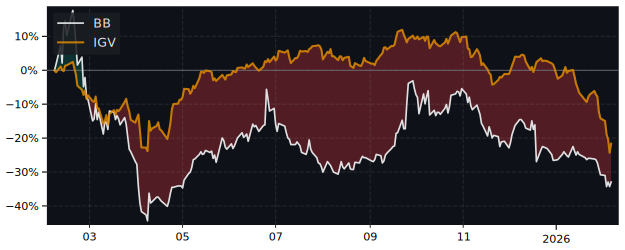
Compare performance with 38 peers in Systems Software
12m Total Return: BB (23%) vs PEER ETF
5y Drawdown (Underwater) Chart
Top Performer in Systems Software (5/38)
Short Term Performance
| SYMBOL | 1W | 1M | 3M |
|---|---|---|---|
| SVCO | 2.37% | 123.40% | 65.17% |
| ATEN | 3.95% | 22.40% | 44.94% |
| NBIS | 22.61% | 31.66% | 28.47% |
| FTNT | 2.91% | -0.36% | 7.00% |
| RIOT | 28.37% | 9.59% | 6.48% |
| BB | 5.06% | 1.44% | -8.55% |
Long Term Performance
| SYMBOL | 6M | 12M | 5Y |
|---|---|---|---|
| NBIS | 2.46% | 523.13% | 98.89% |
| RIOT | -26.74% | 146.33% | -68.74% |
| SVCO | 21.69% | 94.96% | -62.88% |
| ATEN | 36.53% | 70.34% | 199.31% |
| OS | 22.70% | 26.60% | -15.46% |
| BB | -25.84% | 23.00% | -60.91% |
Overall Best Picks of Peer Group (GARP Metrics)
| SYMBOL | MCAP | 1M | 12M | 5Y | P/E | P/E fwd | PEG | EPS stab | EPS cagr |
|---|---|---|---|---|---|---|---|---|---|
| ATEN NYSE A10 Network |
1.72B | 22.4% | 70.3% | 199% | 42.1 | 23.5 | 14.8 | -1.0% | -45.5% |
| PLTR NASDAQ Palantir Technologies |
355B | -10.0% | 82.1% | 503% | 239 | 114 | 2.90 | 68.3% | 24.1% |
| FTNT NASDAQ Fortinet |
61.4B | -0.36% | -5.26% | 112% | 34.1 | 27.3 | 2.04 | 93.6% | 47.2% |
| CRNC NASDAQ Cerence |
326M | 9.76% | 14.1% | -91.9% | 363 | 43.1 | - | -16.9% | -30.2% |
Performance: BB vs S&P 500
Total Return vs S&P 500
| PERIOD | BB | S&P 500 |
|---|---|---|
| 1 Week | 5.06% | 3.17% |
| 1 Month | 1.44% | -0.06% |
| 3 Months | -8.55% | -1.69% |
| 6 Months | -25.84% | 1.00% |
| 12 Months | 23.00% | 37.72% |
| 5 Years | -60.91% | 75.84% |
BB Performance FAQ
Does BB outperform the market?
No, BB underperforms the market. Over the past 12 months, BB returned 23.00% compared to 37.72% for the S&P 500.
What is the BB return over the last 12 months?
BB has returned 23.00% over the past 12 months, including dividends. Over 3 months the return was -8.55%, and over 5 years -60.91%.
How risky is BB?
BB has relatively low risk with a maximum drawdown of 62.32% over the past 3 years. The average drawdown is 35.46%.
BB vs Sectors (12m)
Sorted by outperformance. Positive = BB beats sector.
Relative Performance vs S&P Sectors
| SECTOR | ETF | DIFFERENCE 12M |
|---|---|---|
| Consumer Staples | XLP | 11.6% |
| Health Care | XLV | 8.4% |
| Financials | XLF | 4.6% |
| Real Estate | XLRE | 4.6% |
| Consumer Discretionary | XLY | -3.7% |
| Consumer Discretionary | XLY | -3.7% |
| Communication Services | XLC | -10.8% |
| Materials | XLB | -19.1% |
| Industrials | XLI | -25.4% |
| Energy | XLE | -33.8% |
| Technology | XLK | -35.6% |
BB vs Asset Classes (12m)
Relative Performance vs Major Asset Classes
| ASSET CLASS | ETF | DIFFERENCE 12M |
|---|---|---|
| S&P 500 | SPY | -14.7% |
| Emerging Market | EEM | -37.7% |
| Gold | GLD | -34.9% |
| Long-Term Bonds | TLT | 20.2% |
| Risk-Free Cash | SHY | 19.5% |