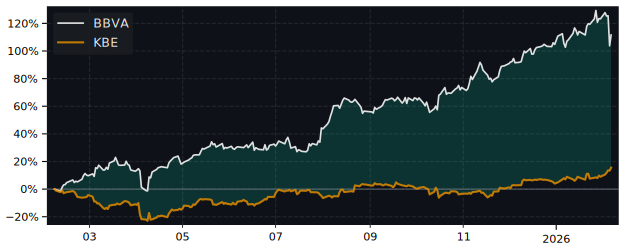
BBVA Performance: 97.3% Return (12 Months)
BBVA returned 97.3% over 12 months, outperforming the S&P 500 (32.2%). Volatility: 30.5%.
| P/E Trailing | 10.8 |
| P/E Forward | 9.99 |
| 52 Week High | 26.11 USD |
| 52 Week Low | 11.23 USD |
| VRO Trend Strength ±100 | 29.22 |
| Buy Signal ±3 | 0.78 |
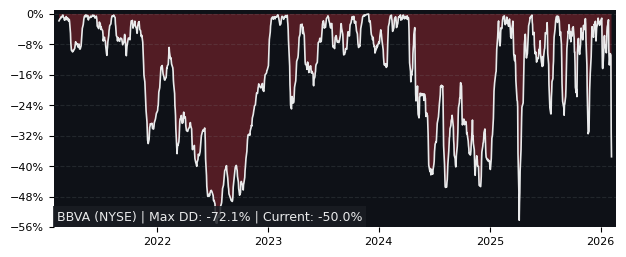
| Max Drawdown | 22.14% |
| Mean Drawdown | 5.69% |
Top Performer in Diversified Banks (5/54)
| SYMBOL | 1W | 1M | 3M |
|---|---|---|---|
| BBT | 2.07% | 5.15% | 16.52% |
| ITUB | 0.16% | 2.13% | 16.09% |
| BAP | -0.51% | 2.38% | 14.89% |
| NTB | 3.64% | 9.26% | 9.80% |
| CIB | 0.43% | 10.39% | 9.70% |
| BBVA | 2.59% | 3.01% | -3.73% |
| SYMBOL | 6M | 12M | 5Y |
|---|---|---|---|
| SHG | 26.32% | 110.23% | 142.01% |
| BAP | 28.49% | 108.37% | 156.54% |
| CIB | 43.15% | 100.71% | 293.22% |
| BBVA | 21.75% | 97.31% | 462.82% |
| MFG | 29.92% | 94.60% | 240.37% |
| BMA | 82.48% | 22.09% | 692.62% |
| SYMBOL | MCAP | 1M | 12M | 5Y | P/E | P/E fwd | PEG | EPS stab | EPS cagr |
|---|---|---|---|---|---|---|---|---|---|
| BCH NYSE Banco De Chile |
18.6B | -2.54% | 54.9% | 124% | 14.5 | 27.3 | 9.10 | -65.0% | -4.44% |
| NTB NYSE Bank of N.T. Butterfield |
2.20B | 9.26% | 57.7% | 87.8% | 9.78 | - | 1.96 | -17.4% | -44.9% |
| CIB NYSE Grupo Cibest S.A. |
18.8B | 10.4% | 101% | 293% | 9.26 | 8.51 | 0.43 | 38.8% | -2.15% |
| HBC1 XETRA HSBC Holdings |
289B | 3.03% | 74.6% | 283% | 14.1 | 10.2 | 1.14 | 7.50% | 17.9% |
| BAP NYSE Credicorp |
27.0B | 2.38% | 108% | 157% | 13.9 | 12.6 | 4.55 | -73.5% | -49.2% |
| BBVA MC Banco Bilbao Vizcaya |
123B | 3.68% | 83.0% | 440% | 10.7 | 9.90 | 1.87 | 90.5% | 16.1% |
Performance: BBVA vs S&P 500
| PERIOD | BBVA | S&P 500 |
|---|---|---|
| 1 Week | 2.59% | 1.37% |
| 1 Month | 3.01% | -2.54% |
| 3 Months | -3.73% | -4.14% |
| 6 Months | 21.75% | -0.92% |
| 12 Months | 97.31% | 32.20% |
| 5 Years | 462.82% | 71.53% |
BBVA Performance FAQ
Does BBVA outperform the market?
Yes, BBVA significantly outperforms the market. Over the past 12 months, BBVA returned 97.31% compared to 32.20% for the S&P 500.
What is the BBVA return over the last 12 months?
BBVA has returned 97.31% over the past 12 months, including dividends. Over 3 months the return was -3.73%, and over 5 years 462.82%.
How risky is BBVA?
BBVA has relatively low risk with a maximum drawdown of 22.14% over the past 3 years. The average drawdown is 5.69%.
BBVA vs Sectors (12m)
Sorted by outperformance. Positive = BBVA beats sector.
| SECTOR | ETF | DIFFERENCE 12M |
|---|---|---|
| Consumer Staples | XLP | 89.6% |
| Health Care | XLV | 86.4% |
| Real Estate | XLRE | 83.8% |
| Financials | XLF | 82.4% |
| Consumer Discretionary | XLY | 77% |
| Communication Services | XLC | 67.7% |
| Communication Services | XLC | 67.7% |
| Materials | XLB | 64% |
| Industrials | XLI | 55.5% |
| Technology | XLK | 46.6% |
| Energy | XLE | 38.6% |
BBVA vs Asset Classes (12m)
| ASSET CLASS | ETF | DIFFERENCE 12M |
|---|---|---|
| S&P 500 | SPY | 49.25% |
| Gold | GLD | 39.6% |
| Long-Term Bonds | TLT | 96.7% |