ITT Performance: 74% Return (12 Months)
ITT returned 74.0% over 12 months, outperforming the S&P 500 (32.2%). Volatility: 27.7%.
| P/E Trailing | 31.6 |
| P/E Forward | 25.9 |
| 52 Week High | 208.44 USD |
| 52 Week Low | 111.73 USD |
| VRO Trend Strength ±100 | 47.61 |
| Buy Signal ±3 | 0.81 |
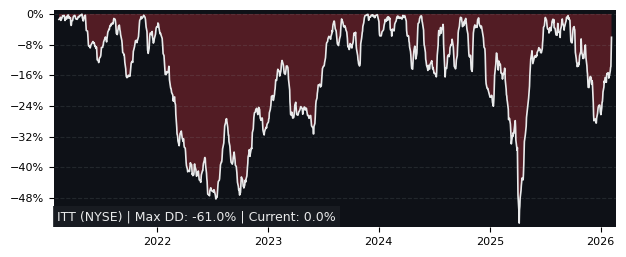
| Max Drawdown | 29.09% |
| Mean Drawdown | 4.83% |
Top Performer in Industrial Machinery & Supplies & Components (5/86)
| SYMBOL | 1W | 1M | 3M |
|---|---|---|---|
| PL | 25.83% | 36.21% | 55.55% |
| ESE | 3.57% | 7.50% | 40.60% |
| NDX1 | -1.05% | 9.74% | 36.13% |
| GRC | 2.69% | 3.44% | 30.84% |
| ITT | 3.00% | 5.34% | 10.54% |
| AZ | 23.69% | 52.50% | 2.61% |
| SYMBOL | 6M | 12M | 5Y |
|---|---|---|---|
| PL | 124.30% | 978.83% | 255.25% |
| RKLB | 7.82% | 278.54% | 497.48% |
| NVRI | 65.14% | 269.90% | 9.35% |
| NDX1 | 94.22% | 215.77% | 96.11% |
| GHM | 52.69% | 214.26% | 507.96% |
| ITT | 10.23% | 73.96% | 126.66% |
| SYMBOL | MCAP | 1M | 12M | 5Y | P/E | P/E fwd | PEG | EPS stab | EPS cagr |
|---|---|---|---|---|---|---|---|---|---|
| ESE NYSE ESCO Technologies |
7.57B | 7.50% | 105% | 166% | 60.6 | 25.4 | 1.67 | 74.8% | 28.0% |
| PH NYSE Parker-Hannifin |
115B | -2.06% | 73.3% | 204% | 33.1 | 27.3 | 3.74 | -22.4% | -44.9% |
| MWA NYSE Mueller Water Products |
4.32B | -0.25% | 23.6% | 110% | 21.8 | 19.1 | 1.27 | 81.7% | 19.2% |
| WTS NYSE Watts Water Technologies |
9.60B | -6.04% | 59.8% | 154% | 28.3 | 24.6 | 3.07 | 76.5% | 13.5% |
| DOV NYSE Dover |
27.7B | -1.64% | 38.5% | 57.9% | 25.8 | 19.5 | 1.82 | 58.8% | 7.71% |
| NDSN NASDAQ Nordson |
14.7B | -1.92% | 57.6% | 38.4% | 28.5 | 22.8 | 1.77 | 34.0% | -0.66% |
| SPXC NYSE SPX |
9.84B | -6.85% | 60.6% | 225% | 39.1 | 25.9 | 1.44 | 20.4% | -39.7% |
| SNA NYSE Snap-On |
19.0B | -1.84% | 21.2% | 77.0% | 19.1 | 18.3 | 2.03 | -35.7% | -46.0% |
| LECO NASDAQ Lincoln Electric Holdings |
13.4B | -8.98% | 45.4% | 114% | 26.2 | 22.6 | 1.61 | 68.2% | 6.40% |
| G1A XETRA GEA |
11.5B | -1.85% | 26.7% | 90.7% | 24.8 | 18.5 | 1.26 | 37.4% | 12.1% |
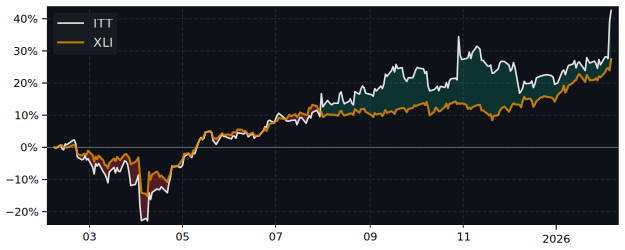
Performance: ITT vs S&P 500
| PERIOD | ITT | S&P 500 |
|---|---|---|
| 1 Week | 3.00% | 1.37% |
| 1 Month | 5.34% | -2.54% |
| 3 Months | 10.54% | -4.14% |
| 6 Months | 10.23% | -0.92% |
| 12 Months | 73.96% | 32.20% |
| 5 Years | 126.66% | 71.53% |
ITT Performance FAQ
Does ITT outperform the market?
Yes, ITT significantly outperforms the market. Over the past 12 months, ITT returned 73.96% compared to 32.20% for the S&P 500.
What is the ITT return over the last 12 months?
ITT has returned 73.96% over the past 12 months, including dividends. Over 3 months the return was 10.54%, and over 5 years 126.66%.
How risky is ITT?
ITT has relatively low risk with a maximum drawdown of 29.09% over the past 3 years. The average drawdown is 4.83%.
ITT vs Sectors (12m)
Sorted by outperformance. Positive = ITT beats sector.
| SECTOR | ETF | DIFFERENCE 12M |
|---|---|---|
| Consumer Staples | XLP | 66.3% |
| Health Care | XLV | 63% |
| Real Estate | XLRE | 60.4% |
| Financials | XLF | 59.1% |
| Consumer Discretionary | XLY | 53.7% |
| Communication Services | XLC | 44.4% |
| Communication Services | XLC | 44.4% |
| Materials | XLB | 40.7% |
| Industrials | XLI | 32.1% |
| Technology | XLK | 23.3% |
| Energy | XLE | 15.3% |
ITT vs Asset Classes (12m)
| ASSET CLASS | ETF | DIFFERENCE 12M |
|---|---|---|
| S&P 500 | SPY | 31.59% |
| Gold | GLD | 16.2% |
| Long-Term Bonds | TLT | 73.4% |