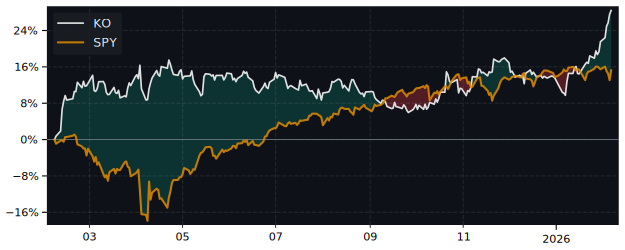
KO Performance: 16.2% Return (12 Months)
KO returned 16.2% over 12 months, underperforming the S&P 500 (32.1%). Volatility: 16.6%.
RS IBD
32.27
Top 41% in Peers
Volatility
16.6%
Top 4% in Peers
Total Return 12m
16.22%
Top 41% in Peers
RS Rating
65.34
Top 41% in Peers
P/E
| P/E Trailing | 25.2 |
| P/E Forward | 23.7 |
High / Low 52w
| 52 Week High | 81.00 USD |
| 52 Week Low | 64.77 USD |
Sentiment
| VRO Trend Strength ±100 | 50.78 |
| Buy Signal ±3 | 0.00 |
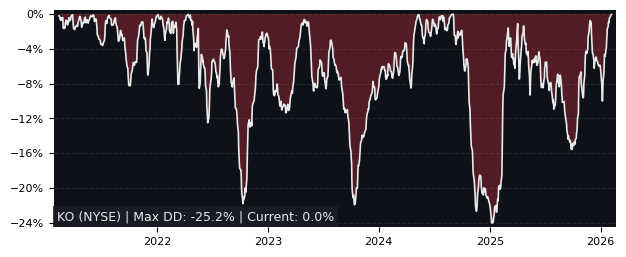
Drawdowns 3y
| Max Drawdown | 17.27% |
| Mean Drawdown | 4.94% |
Compare performance with 11 peers in Soft Drinks & Non-alcoholic Beverages
12m Total Return: KO (16.2%) vs PEER ETF
5y Drawdown (Underwater) Chart
Top Performer in Soft Drinks & Non-alcoholic Beverages (5/11)
Short Term Performance
| SYMBOL | 1W | 1M | 3M |
|---|---|---|---|
| COKE | 6.56% | -3.14% | 36.22% |
| FMX | 5.21% | 3.84% | 15.08% |
| KO | 1.25% | 0.92% | 14.61% |
| PEP | -0.06% | -1.69% | 13.80% |
| CCEP | 2.36% | -6.92% | 8.83% |
| FIZZ | 0.98% | -4.37% | 6.26% |
Long Term Performance
| SYMBOL | 6M | 12M | 5Y |
|---|---|---|---|
| COCO | 15.43% | 71.62% | 266.35% |
| COKE | 67.26% | 54.88% | 590.35% |
| FMX | 24.67% | 33.09% | 67.24% |
| MNST | 10.54% | 29.85% | 55.63% |
| KO | 18.45% | 16.22% | 68.72% |
| KOF | 22.93% | 15.69% | 156.79% |
Performance: KO vs S&P 500
Total Return vs S&P 500
| PERIOD | KO | S&P 500 | DIFFERENCE |
|---|---|---|---|
| 1 Month | 0.92% | -1.73% | 2.70% |
| 3 Months | 14.61% | -4.49% | 20.00% |
| 6 Months | 18.45% | -1.33% | 20.05% |
| 12 Months | 16.22% | 32.14% | -12.05% |
| 5 Years | 68.72% | 72.70% | -2.30% |
KO Performance FAQ
Does KO outperform the market?
No, KO underperforms the market. Over the past 12 months, KO returned 16.22% compared to 32.14% for the S&P 500.
What is the KO return over the last 12 months?
KO has returned 16.22% over the past 12 months, including dividends. Over 3 months the return was 14.61%, and over 5 years 68.72%.
How risky is KO?
KO has relatively low risk with a maximum drawdown of 17.27% over the past 3 years. The average drawdown is 4.94%.
KO vs Sectors (12m)
Sorted by outperformance. Positive = KO beats sector.
Relative Performance vs S&P Sectors
| SECTOR | ETF | DIFFERENCE 12M |
|---|---|---|
| Consumer Staples | XLP | 6.7% |
| Health Care | XLV | 5.5% |
| Real Estate | XLRE | 2.6% |
| Financials | XLF | 1.3% |
| Consumer Discretionary | XLY | -5.5% |
| Consumer Discretionary | XLY | -5.5% |
| Communication Services | XLC | -13.3% |
| Materials | XLB | -17.4% |
| Industrials | XLI | -25.9% |
| Technology | XLK | -33.7% |
| Energy | XLE | -41.2% |
KO vs Asset Classes (12m)
Relative Performance vs Major Asset Classes
| ASSET CLASS | ETF | DIFFERENCE 12M |
|---|---|---|
| S&P 500 | SPY | -12.05% |
| Gold | GLD | -40% |
| Long-Term Bonds | TLT | 15.6% |