MTRN Performance: 99.4% Return (12 Months)
MTRN returned 99.4% over 12 months, outperforming the S&P 500 (23.6%). Volatility: 41.9%.
RS IBD
51.50
Top 35% in Peers
Volatility
41.9%
Top 14% in Peers
Total Return 12m
99.43%
Top 46% in Peers
RS Rating
88.80
Top 35% in Peers
P/E
| P/E Trailing | 39.5 |
| P/E Forward | 22.4 |
High / Low 52w
| 52 Week High | 166.59 USD |
| 52 Week Low | 71.78 USD |
Sentiment
| VRO Trend Strength ±100 | 32.37 |
| Buy Signal ±3 | 0.28 |
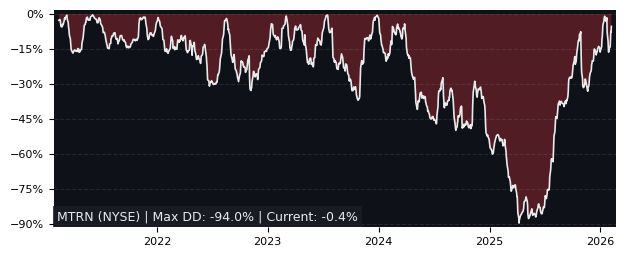
Drawdowns 3y
| Max Drawdown | 47.84% |
| Mean Drawdown | 17.33% |
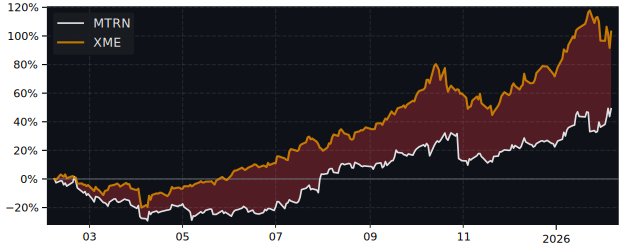
Compare performance with 45 peers in Diversified Metals & Mining
12m Total Return: MTRN (99.4%) vs SPY (23.6%)
5y Drawdown (Underwater) Chart
Top Performer in Diversified Metals & Mining (5/45)
Short Term Performance
| SYMBOL | 1W | 1M | 3M |
|---|---|---|---|
| YDDL | -3.90% | 86.13% | 140.33% |
| ECVT | 1.56% | 13.69% | 31.58% |
| LAR | 20.32% | 9.46% | 23.48% |
| AMG | 5.05% | 11.26% | 16.48% |
| MTRN | 5.47% | -7.53% | 15.08% |
| AMR | -6.25% | 20.67% | 3.71% |
Long Term Performance
| SYMBOL | 6M | 12M | 5Y |
|---|---|---|---|
| LAR | 82.08% | 270.44% | 18.83% |
| SKE | 77.03% | 217.35% | 179.62% |
| CGAU | 62.05% | 201.00% | 135.92% |
| IAUX | 74.74% | 195.53% | -20.19% |
| YDDL | 145.20% | 145.20% | 145.20% |
| MTRN | 20.10% | 99.43% | 124.83% |
Overall Best Picks of Peer Group (GARP Metrics)
| SYMBOL | MCAP | 1M | 12M | 5Y | P/E | P/E fwd | PEG | EPS stab | EPS cagr |
|---|---|---|---|---|---|---|---|---|---|
| VOXR NASDAQ Vox Royalty Common Stock |
361M | -12.4% | 86.3% | 181% | 52.4 | 137 | - | 4.10% | -9.86% |
| RIO NYSE Rio Tinto |
144B | 1.87% | 70.2% | 75.0% | 14.6 | 11.0 | 5.69 | -4.50% | - |
| BHP NYSE BHP |
188B | -4.66% | 64.2% | 62.8% | 18.3 | 14.7 | 5.95 | -18.2% | -41.4% |
| CGAU NYSE Centerra Gold |
3.55B | -5.99% | 201% | 136% | 6.26 | 10.8 | - | 67.3% | 18.1% |
| ORLA NYSE MKT Orla Mining |
4.11B | -15.1% | 80.2% | 356% | 75.6 | 10.9 | - | 17.1% | -4.30% |
| HBM NYSE Hudbay Minerals |
7.56B | -13.2% | 205% | 187% | 13.5 | 11.0 | 2.09 | 38.5% | -21.8% |
| IDR NYSE MKT Idaho Strategic Resources |
433M | -9.75% | 121% | 868% | 24.0 | 17.8 | - | 74.5% | 10.9% |
| ITRG NYSE MKT Integra Resources |
518M | -27.1% | 150% | 0.35% | - | 4.38 | - | 71.8% | 50.3% |
Performance: MTRN vs S&P 500
Total Return vs S&P 500
| PERIOD | MTRN | S&P 500 | DIFFERENCE |
|---|---|---|---|
| 1 Month | -7.53% | -3.34% | -4.33% |
| 3 Months | 15.08% | -4.38% | 20.4% |
| 6 Months | 20.10% | -1.44% | 21.9% |
| 12 Months | 99.43% | 23.60% | 61.4% |
| 5 Years | 124.83% | 72.80% | 30.1% |
FAQs
Does MTRN outperform the market?
Yes, MTRN significantly outperforms the market.
Over the past 12 months, MTRN returned 99.43% compared to 23.60% for the S&P 500.
What is the MTRN return over the last 12 months?
MTRN has returned 99.43% over the past 12 months, including dividends.
Over 3 months the return was 15.08%, and over 5 years 124.83%.
How risky is MTRN?
MTRN has relatively low risk with a maximum drawdown of 47.84% over the past 3 years.
The average drawdown is 17.33%.
MTRN vs Sectors (12m)
Sorted by outperformance. Positive = MTRN beats sector.
| Sector | ETF | Difference |
|---|---|---|
| Consumer Staples | XLP | 96.8% |
| Health Care | XLV | 95.0% |
| Financials | XLF | 94.0% |
| Real Estate | XLRE | 94.0% |
| Consumer Discretionary | XLY | 85.3% |
| Consumer Discretionary | XLY | 85.3% |
| Communication Services | XLC | 77.2% |
| Materials | XLB | 75.7% |
| Industrials | XLI | 67.6% |
| Technology | XLK | 59.3% |
| Energy | XLE | 58.4% |
MTRN vs Asset Classes (12m)
| Asset Class | ETF | Difference |
|---|---|---|
| S&P 500 | SPY | 61.4% |
| Gold | GLD | 49.5% |
| Long-Term Bonds | TLT | 101% |