ONTO Performance: 96.2% Return (12 Months)
ONTO returned 96.2% over 12 months, outperforming the S&P 500 (23.6%). Volatility: 68.2%.
RS (IBD)
71.71
Top 49% in Peers
Volatility
68.2%
Top 68% in Peers
Total Return 12m
96.24%
Top 69% in Peers
RS Rating
92.70
Top 49% in Peers
| P/E | Value |
|---|---|
| P/E Trailing | 68.1 |
| P/E Forward | 31.1 |
| High / Low | USD |
|---|---|
| 52 Week High | 225.33 USD |
| 52 Week Low | 88.50 USD |
| Sentiment | Value |
|---|---|
| VRO Trend Strength +-100 | 44.44 |
| Buy Signal +-3 | -0.08 |
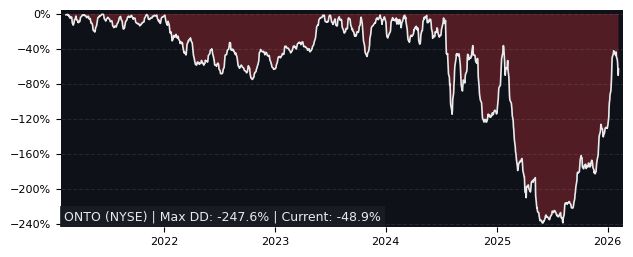
| Drawdowns | in 3y |
|---|---|
| Max Drawdown | 62.82% |
| Mean Drawdown | 21.59% |
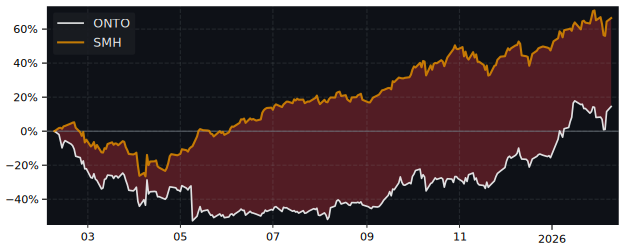
Peer Group: Semiconductor Materials & Equipment (36 symbols)
12m Total Return: ONTO (96.2%) vs SPY (23.6%)
5y Drawdown (Underwater) Chart
Top Performer in Semiconductor Materials & Equipment (5/36)
Short Term Performance
| Symbol | 1w | 1m | 3m |
|---|---|---|---|
| ONTO | 5.53% | 3.87% | 20.96% |
| ICHR | 6.39% | 5.78% | 129.80% |
| UCTT | 7.29% | 5.97% | 113.02% |
| SOI | -7.03% | 19.02% | 91.06% |
| INTT | 0.29% | 14.58% | 82.02% |
| AIXA | -1.68% | 15.28% | 63.14% |
Long Term Performance
| Symbol | 6m | 12m | 5y |
|---|---|---|---|
| ONTO | 49.98% | 96.24% | 200.94% |
| FORM | 159.91% | 308.55% | 101.80% |
| MU | 95.15% | 393.83% | 300.55% |
| TER | 112.84% | 313.85% | 138.04% |
| AEIS | 91.29% | 297.14% | 181.40% |
| AIXA | 124.11% | 248.76% | 79.81% |
Performance: ONTO vs S&P 500
| Total Return | ONTO | S&P 500 | Difference |
|---|---|---|---|
| 1 Month | 3.87% | -3.34% | 7.46% |
| 3 Months | 20.96% | -4.38% | 26.5% |
| 6 Months | 49.98% | -1.44% | 52.2% |
| 12 Months | 96.24% | 23.60% | 58.8% |
| 5 Years | 200.94% | 72.80% | 74.2% |
FAQs
Does ONTO outperform the market?
Yes, ONTO significantly outperforms the market.
Over the past 12 months, ONTO returned 96.24% compared to 23.60% for the S&P 500.
What is the ONTO return over the last 12 months?
ONTO has returned 96.24% over the past 12 months, including dividends.
Over 3 months the return was 20.96%, and over 5 years 200.94%.
How risky is ONTO?
ONTO has relatively low risk with a maximum drawdown of 62.82% over the past 3 years.
The average drawdown is 21.59%.
ONTO vs Sectors (12m)
Sorted by outperformance. Positive = ONTO beats sector.
| Sector | ETF | Difference |
|---|---|---|
| Consumer Staples | XLP | 93.6% |
| Health Care | XLV | 91.8% |
| Financials | XLF | 90.8% |
| Real Estate | XLRE | 90.8% |
| Consumer Discretionary | XLY | 82.1% |
| Consumer Discretionary | XLY | 82.1% |
| Communication Services | XLC | 74.0% |
| Materials | XLB | 72.5% |
| Industrials | XLI | 64.4% |
| Technology | XLK | 56.1% |
| Energy | XLE | 55.2% |
ONTO vs Asset Classes (12m)
| Asset Class | ETF | Difference |
|---|---|---|
| S&P 500 | SPY | 58.8% |
| Gold | GLD | 46.3% |
| Long-Term Bonds | TLT | 97.5% |