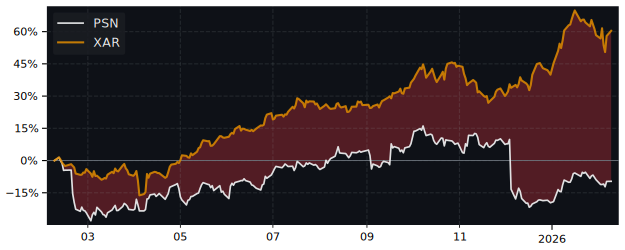
PSN Performance: -4.4% Return (12 Months)
PSN returned -4.3% over 12 months, underperforming the S&P 500 (31.5%). Volatility: 56.5%.
| P/E Trailing | 25.0 |
| P/E Forward | 14.9 |
| 52 Week High | 89.29 USD |
| 52 Week Low | 50.04 USD |
| VRO Trend Strength ±100 | 34.23 |
| Buy Signal ±3 | -0.27 |
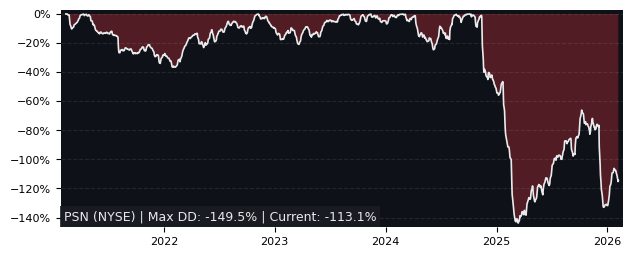
| Max Drawdown | 55.84% |
| Mean Drawdown | 17.49% |
Top Performer in Aerospace & Defense (5/48)
| SYMBOL | 1W | 1M | 3M |
|---|---|---|---|
| ESLT | 8.84% | 0.10% | 41.51% |
| EXA | 13.87% | 12.52% | 35.99% |
| NPK | 6.92% | 5.31% | 29.43% |
| FLY | 39.42% | 61.58% | 27.78% |
| PKE | 5.61% | 3.75% | 27.57% |
| PSN | 7.87% | -13.95% | -15.35% |
| SYMBOL | 6M | 12M | 5Y |
|---|---|---|---|
| ISSC | 82.20% | 296.48% | 259.78% |
| EXA | 41.49% | 277.84% | 1008.68% |
| ATRO | 44.75% | 221.99% | 277.31% |
| KRMN | 15.64% | 220.62% | 185.62% |
| ESLT | 69.39% | 145.15% | 550.03% |
| PSN | -36.24% | -4.35% | 37.90% |
| SYMBOL | MCAP | 1M | 12M | 5Y | P/E | P/E fwd | PEG | EPS stab | EPS cagr |
|---|---|---|---|---|---|---|---|---|---|
| CW NYSE Curtiss-Wright |
25.6B | 2.42% | 142% | 487% | 54.0 | 28.4 | 2.0 | -3.40% | -42.0% |
| HWM NYSE MKT Howmet Aerospace |
96.2B | -7.81% | 101% | 636% | 64.4 | 50.3 | 0.80 | 99.1% | 38.5% |
| ISSC NASDAQ Innovative Solutions Support |
486M | -20.3% | 296% | 260% | 25.8 | 9.50 | 0.83 | 61.1% | 35.5% |
| BSP XETRA BAE Systems |
88.9B | 6.08% | 52.4% | 390% | 33.8 | 25.9 | 3.62 | - | - |
| ATRO NASDAQ Astronics |
2.49B | -7.52% | 222% | 277% | 86.2 | 27.2 | 1.45 | 73.2% | 37.6% |
Performance: PSN vs S&P 500
| PERIOD | PSN | S&P 500 | DIFFERENCE |
|---|---|---|---|
| 1 Month | -13.95% | -3.48% | -10.85% |
| 3 Months | -15.35% | -4.38% | -11.47% |
| 6 Months | -36.24% | -1.79% | -35.07% |
| 12 Months | -4.35% | 31.52% | -27.27% |
| 5 Years | 37.90% | 72.80% | -20.20% |
PSN Performance FAQ
Does PSN outperform the market?
No, PSN underperforms the market. Over the past 12 months, PSN returned -4.35% compared to 31.52% for the S&P 500.
What is the PSN return over the last 12 months?
PSN has returned -4.35% over the past 12 months, including dividends. Over 3 months the return was -15.35%, and over 5 years 37.90%.
How risky is PSN?
PSN has relatively low risk with a maximum drawdown of 55.84% over the past 3 years. The average drawdown is 17.49%.
PSN vs Sectors (12m)
Sorted by outperformance. Positive = PSN beats sector.
| SECTOR | ETF | DIFFERENCE 12M |
|---|---|---|
| Consumer Staples | XLP | -12.9% |
| Health Care | XLV | -15.5% |
| Real Estate | XLRE | -17.6% |
| Financials | XLF | -18.4% |
| Consumer Discretionary | XLY | -25% |
| Communication Services | XLC | -33.8% |
| Communication Services | XLC | -33.8% |
| Materials | XLB | -38.5% |
| Industrials | XLI | -45.7% |
| Technology | XLK | -53.5% |
| Energy | XLE | -60.7% |
PSN vs Asset Classes (12m)
| ASSET CLASS | ETF | DIFFERENCE 12M |
|---|---|---|
| S&P 500 | SPY | -27.27% |
| Gold | GLD | -61.2% |
| Long-Term Bonds | TLT | -5.1% |