ROK Performance: 55% Return (12 Months)
ROK returned 55.0% over 12 months, outperforming the S&P 500 (23.6%). Volatility: 29.7%.
| P/E Trailing | 39.8 |
| P/E Forward | 29.2 |
| 52 Week High | 428.82 USD |
| 52 Week Low | 215.66 USD |
| VRO Trend Strength ±100 | 16.27 |
| Buy Signal ±3 | -0.37 |
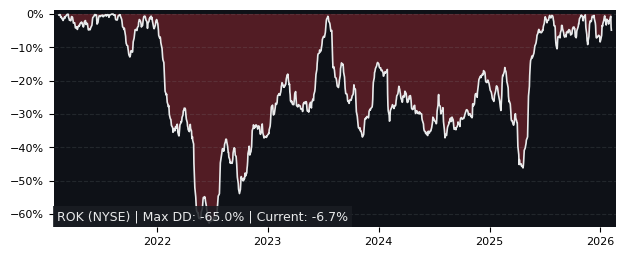
| Max Drawdown | 34.84% |
| Mean Drawdown | 12.57% |
Top Performer in Electrical Components & Equipment (5/33)
| SYMBOL | 1W | 1M | 3M |
|---|---|---|---|
| AMPX | -0.74% | 37.58% | 73.72% |
| POWL | 1.82% | 7.18% | 51.66% |
| VRT | 4.07% | 6.92% | 50.25% |
| THR | 1.80% | 11.95% | 35.63% |
| PLPC | 9.84% | 20.63% | 34.43% |
| ROK | 3.85% | -8.40% | -9.50% |
| SYMBOL | 6M | 12M | 5Y |
|---|---|---|---|
| AMPX | 25.59% | 529.92% | 60.00% |
| VRT | 63.20% | 287.75% | 1151.71% |
| POWL | 80.40% | 223.73% | 1669.26% |
| ELVA | 30.26% | 214.45% | 10.24% |
| ALNT | 38.59% | 197.14% | 71.13% |
| ROK | 5.22% | 54.97% | 48.45% |
| SYMBOL | MCAP | 1M | 12M | 5Y | P/E | P/E fwd | PEG | EPS stab | EPS cagr |
|---|---|---|---|---|---|---|---|---|---|
| VRT NYSE Vertiv Holdings |
99.2B | 6.92% | 288% | 1,152% | 76.3 | 44.3 | 1.70 | 58.1% | -24.4% |
| PRY MI Prysmian SpA |
33.3B | 7.08% | 125% | 309% | 24.4 | 21.2 | 0.62 | 42.5% | 15.3% |
| NVT NYSE nVent Electric |
19.6B | 5.65% | 147% | 342% | 46.8 | 28.6 | 1.60 | -5.10% | -44.4% |
| THR NYSE Thermon Holdings |
1.68B | 12.0% | 101% | 170% | 28.9 | 21.9 | 0.98 | 0.80% | -40.9% |
Performance: ROK vs S&P 500
| PERIOD | ROK | S&P 500 | DIFFERENCE |
|---|---|---|---|
| 1 Month | -8.40% | -3.34% | -5.24% |
| 3 Months | -9.50% | -4.38% | -5.36% |
| 6 Months | 5.22% | -1.44% | 6.76% |
| 12 Months | 54.97% | 23.60% | 25.38% |
| 5 Years | 48.45% | 72.80% | -14.09% |
ROK Performance FAQ
Does ROK outperform the market?
Yes, ROK significantly outperforms the market. Over the past 12 months, ROK returned 54.97% compared to 23.60% for the S&P 500.
What is the ROK return over the last 12 months?
ROK has returned 54.97% over the past 12 months, including dividends. Over 3 months the return was -9.50%, and over 5 years 48.45%.
How risky is ROK?
ROK has relatively low risk with a maximum drawdown of 34.84% over the past 3 years. The average drawdown is 12.57%.
ROK vs Sectors (12m)
Sorted by outperformance. Positive = ROK beats sector.
| SECTOR | ETF | DIFFERENCE 12M |
|---|---|---|
| Consumer Staples | XLP | 52.4% |
| Health Care | XLV | 50.6% |
| Financials | XLF | 49.5% |
| Real Estate | XLRE | 49.5% |
| Consumer Discretionary | XLY | 40.9% |
| Consumer Discretionary | XLY | 40.9% |
| Communication Services | XLC | 32.8% |
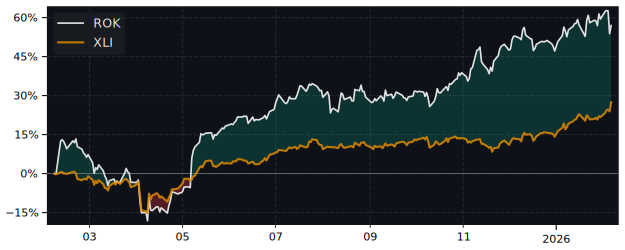
| Materials | XLB | 31.2% |
| Industrials | XLI | 23.1% |
| Technology | XLK | 14.9% |
| Energy | XLE | 14% |
ROK vs Asset Classes (12m)
| ASSET CLASS | ETF | DIFFERENCE 12M |
|---|---|---|
| S&P 500 | SPY | 25.38% |
| Gold | GLD | 5.1% |
| Long-Term Bonds | TLT | 56.2% |