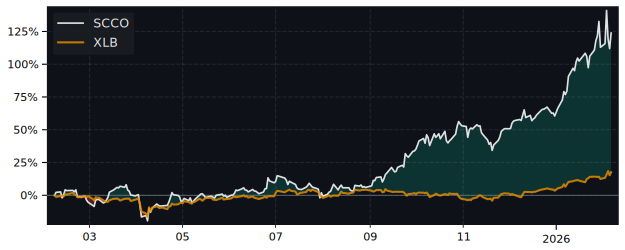
SCCO Performance: 118.2% Return (12 Months)
SCCO returned 118.2% over 12 months, outperforming the S&P 500 (23.6%). Volatility: 53.0%.
RS (IBD)
52.54
Top 31% in Peers
Volatility
53.0%
Top 36% in Peers
Total Return 12m
118.24%
Top 41% in Peers
RS Rating
91.43
Top 31% in Peers
| P/E | Value |
|---|---|
| P/E Trailing | 34.2 |
| P/E Forward | 38.8 |
| High / Low | USD |
|---|---|
| 52 Week High | 218.85 USD |
| 52 Week Low | 71.05 USD |
| Sentiment | Value |
|---|---|
| VRO Trend Strength +-100 | 19.33 |
| Buy Signal +-3 | -0.40 |
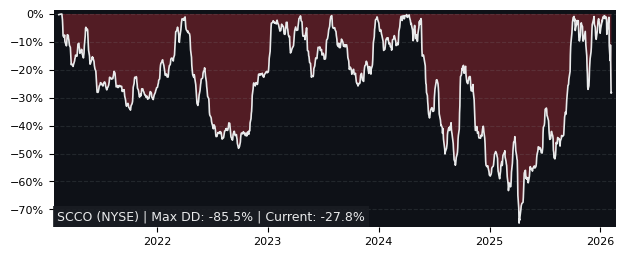
| Drawdowns | in 3y |
|---|---|
| Max Drawdown | 39.69% |
| Mean Drawdown | 12.98% |
Peer Group: Metals & Mining (121 symbols)
12m Total Return: SCCO (118.2%) vs SPY (23.6%)
5y Drawdown (Underwater) Chart
Top Performer in Metals & Mining (5/121)
Short Term Performance
| Symbol | 1w | 1m | 3m |
|---|---|---|---|
| SCCO | 9.72% | -13.77% | 16.67% |
| YDDL | -3.90% | 86.13% | 140.33% |
| AUGO | 25.15% | 4.95% | 68.59% |
| CENX | 26.02% | 18.24% | 42.76% |
| KCO | 1.33% | 11.09% | 47.58% |
| SSRM | 19.40% | 9.16% | 45.93% |
Long Term Performance
| Symbol | 6m | 12m | 5y |
|---|---|---|---|
| SCCO | 42.45% | 118.24% | 220.16% |
| AUGO | 147.98% | 388.73% | 1015.32% |
| ARIS | 92.14% | 302.80% | 605.23% |
| CENX | 109.47% | 258.36% | 287.19% |
| LAR | 82.08% | 270.44% | 18.83% |
| AG | 80.47% | 239.84% | 36.54% |
Overall best picks of Peer Group (GARP Metrics)
| Symbol | Market Cap | 1m | 12m | 5y | P/E | P/E Forward | PEG | EPS Stability | EPS CAGR |
|---|---|---|---|---|---|---|---|---|---|
| CSTM NYSE Constellium |
3.81B | 6.93% | 202% | 85.1% | 14.4 | 8.16 | 0.40 | -10.6% | -14.2% |
| VK PA Vallourec |
5.65B | 14.5% | 48.1% | 137% | 14.9 | 7.80 | 7.24 | 32.0% | 173% |
Performance: SCCO vs S&P 500
| Total Return | SCCO | S&P 500 | Difference |
|---|---|---|---|
| 1 Month | -13.77% | -3.34% | -10.8% |
| 3 Months | 16.67% | -4.38% | 22.0% |
| 6 Months | 42.45% | -1.44% | 44.5% |
| 12 Months | 118.24% | 23.60% | 76.6% |
| 5 Years | 220.16% | 72.80% | 85.3% |
FAQs
Does SCCO outperform the market?
Yes, SCCO significantly outperforms the market.
Over the past 12 months, SCCO returned 118.24% compared to 23.60% for the S&P 500.
What is the SCCO return over the last 12 months?
SCCO has returned 118.24% over the past 12 months, including dividends.
Over 3 months the return was 16.67%, and over 5 years 220.16%.
How risky is SCCO?
SCCO has relatively low risk with a maximum drawdown of 39.69% over the past 3 years.
The average drawdown is 12.98%.
SCCO vs Sectors (12m)
Sorted by outperformance. Positive = SCCO beats sector.
| Sector | ETF | Difference |
|---|---|---|
| Consumer Staples | XLP | 116% |
| Health Care | XLV | 114% |
| Financials | XLF | 113% |
| Real Estate | XLRE | 113% |
| Consumer Discretionary | XLY | 104% |
| Consumer Discretionary | XLY | 104% |
| Communication Services | XLC | 96.0% |
| Materials | XLB | 94.5% |
| Industrials | XLI | 86.4% |
| Technology | XLK | 78.1% |
| Energy | XLE | 77.2% |
SCCO vs Asset Classes (12m)
| Asset Class | ETF | Difference |
|---|---|---|
| S&P 500 | SPY | 76.6% |
| Gold | GLD | 68.3% |
| Long-Term Bonds | TLT | 119% |